
In one consolidated portfolio, a quarter of assets sat outside the defined position-sizing range. Some positions were too small to contribute meaningfully to overall performance, while others were large enough to create concentration risk.
A conventional diversification summary could make this difficult to see. A portfolio spread across numerous holdings and asset classes may appear broadly diversified, even though the distribution of capital between those holdings tells a different story. The effectiveness of diversification also depends on the relationships between investments: holdings that behave differently from one another can reduce unsystematic risk more effectively than holdings whose returns are closely correlated (Markowitz, 1952; Sharpe, 1964).
The Cecily Group’s independent reporting consolidates holdings across managers and examines exposures at the position level, helping investment committees assess how capital is actually distributed across the portfolio.
When Diversification by Numbers Becomes an Inadequate Defence
When position counts suggest broad diversification, holdings outside the intended sizing range may reflect deliberate portfolio choices. Two arguments are particularly relevant.
“Small positions preserve optionality”
A small allocation can provide exposure to an investment idea without committing significant capital. This can suit investments where capital is deployed gradually. In liquid portfolios, however, a position that remains at a very small weight may contribute little to overall performance while still requiring monitoring and oversight.
“Large positions represent our highest-conviction holdings”
A substantial allocation may reflect confidence in an issuer, a core benchmark exposure through an ETF or a long-term income strategy. Yet conviction does not remove concentration risk. The larger the position becomes, the greater its potential influence on consolidated family wealth if the investment performs poorly.
The number of securities required for adequate diversification has long been debated. Evans and Archer (1968) suggested that much of the benefit could be achieved with around 10 stocks, while Statman (1987) estimated that at least 30–40 may be required. The appropriate number depends partly on how the investments behave in relation to one another: adding securities provides less diversification when their returns are highly correlated. Security count alone therefore cannot establish whether a portfolio is genuinely diversified; portfolio weights, correlations and underlying exposures also matter (Fabozzi, Markowitz and Gupta, 2008).
Position count therefore provides little evidence that each holding still has an appropriate role within the portfolio. How does a portfolio accumulate positions that are either too small to contribute meaningfully or large enough to dominate its risk?
How Position-Sizing Drift Develops
Position sizes change even when an investment committee makes no new allocation decision. Some holdings appreciate and become progressively larger shares of the portfolio without rebalancing. Others may decline, be partially sold or remain after an investment thesis has weakened, leaving increasingly small residual positions. Over time, the distribution of capital can move away from the structure originally intended.
Position count provides an incomplete picture of this change. A portfolio may keep the same number of holdings while the economic significance of those holdings changes substantially. It can contain many investments while still being dominated by a relatively small number of large positions.
Position sizing provides a more useful perspective. By assessing individual holdings against an appropriate sizing range, reporting can identify where capital is concentrated and where positions have become too small to contribute meaningfully. Portfolio research similarly shows that risk depends on the weights of individual investments, alongside their risk characteristics and relationships with other assets (Fabozzi, Markowitz and Gupta, 2008).
Consider a position that was initially large enough to contribute meaningfully to portfolio performance. Following a substantial decline or partial sale, it may represent only a small fraction of the portfolio. If the remaining holding is neither rebuilt nor exited, its reduced size effectively becomes the new allocation without the investment committee deliberately choosing it.
At the other end of the distribution, oversized positions increase the portfolio’s dependence on a smaller number of investments. Strong historical performance may itself have contributed to their size. Unless position weights are reviewed explicitly, past success can therefore increase the amount of capital exposed to a future adverse event.
This is position-sizing drift: the gradual movement of holdings away from their intended economic significance without an equivalent governance decision to change the portfolio’s risk structure. The result can be a portfolio with numerous holdings but an uneven distribution of capital. The reporting question is whether current position sizes still reflect deliberate allocation decisions.
Detecting When Diversification Exists Mainly in the Position Count
Three position-level analyses provide a clearer view of how capital is distributed and where holdings have moved outside the intended sizing range.
1. Position Sizing Bandwidth Analysis

What it does: Establishes a target range for individual position sizes against which current holdings can be assessed.
Required inputs: Consolidated portfolio value, individual holding values and the position-sizing parameters used for the portfolio.
What it reveals: Which holdings fall within the intended range and which have become sub-scale or oversized.
Why it matters: Position count alone treats every holding equally. A sizing bandwidth identifies positions that may be too small to contribute meaningfully and those large enough to create disproportionate concentration risk.
Subtleties & Limitations:
Portfolio-specific thresholds. An appropriate bandwidth depends on portfolio size, investment strategy and the characteristics of the underlying assets. Position-sizing thresholds should therefore be established for the individual portfolio rather than treated as universal limits.
Asset characteristics. The same sizing logic may not apply equally to liquid securities and investments where capital is drawn or deployed gradually.
2. Position Distribution Analysis

What it does: Measures how much of the portfolio falls below, within and above the defined position-sizing bandwidth.
Required inputs: Individual position values, consolidated portfolio value and the applicable sizing thresholds.
What it reveals: Whether capital is predominantly held within the intended range or distributed towards the extremes. In the consolidated portfolio analysed, approximately 12% of assets were held below the lower threshold and 13% above the upper threshold.
Why it matters: Two portfolios with similar numbers of holdings can have very different structures. Comparing position sizes across managers can reveal where capital is more concentrated or dispersed, even when the overall number of holdings appears similar.
Subtleties & Limitations:
Distribution does not establish diversification. A portfolio can have most positions within the intended sizing range while retaining correlated exposures to the same economic risks. Position-level correlation analysis is therefore needed to assess this dimension of diversification.
3. Market Value vs. Performance Mapping
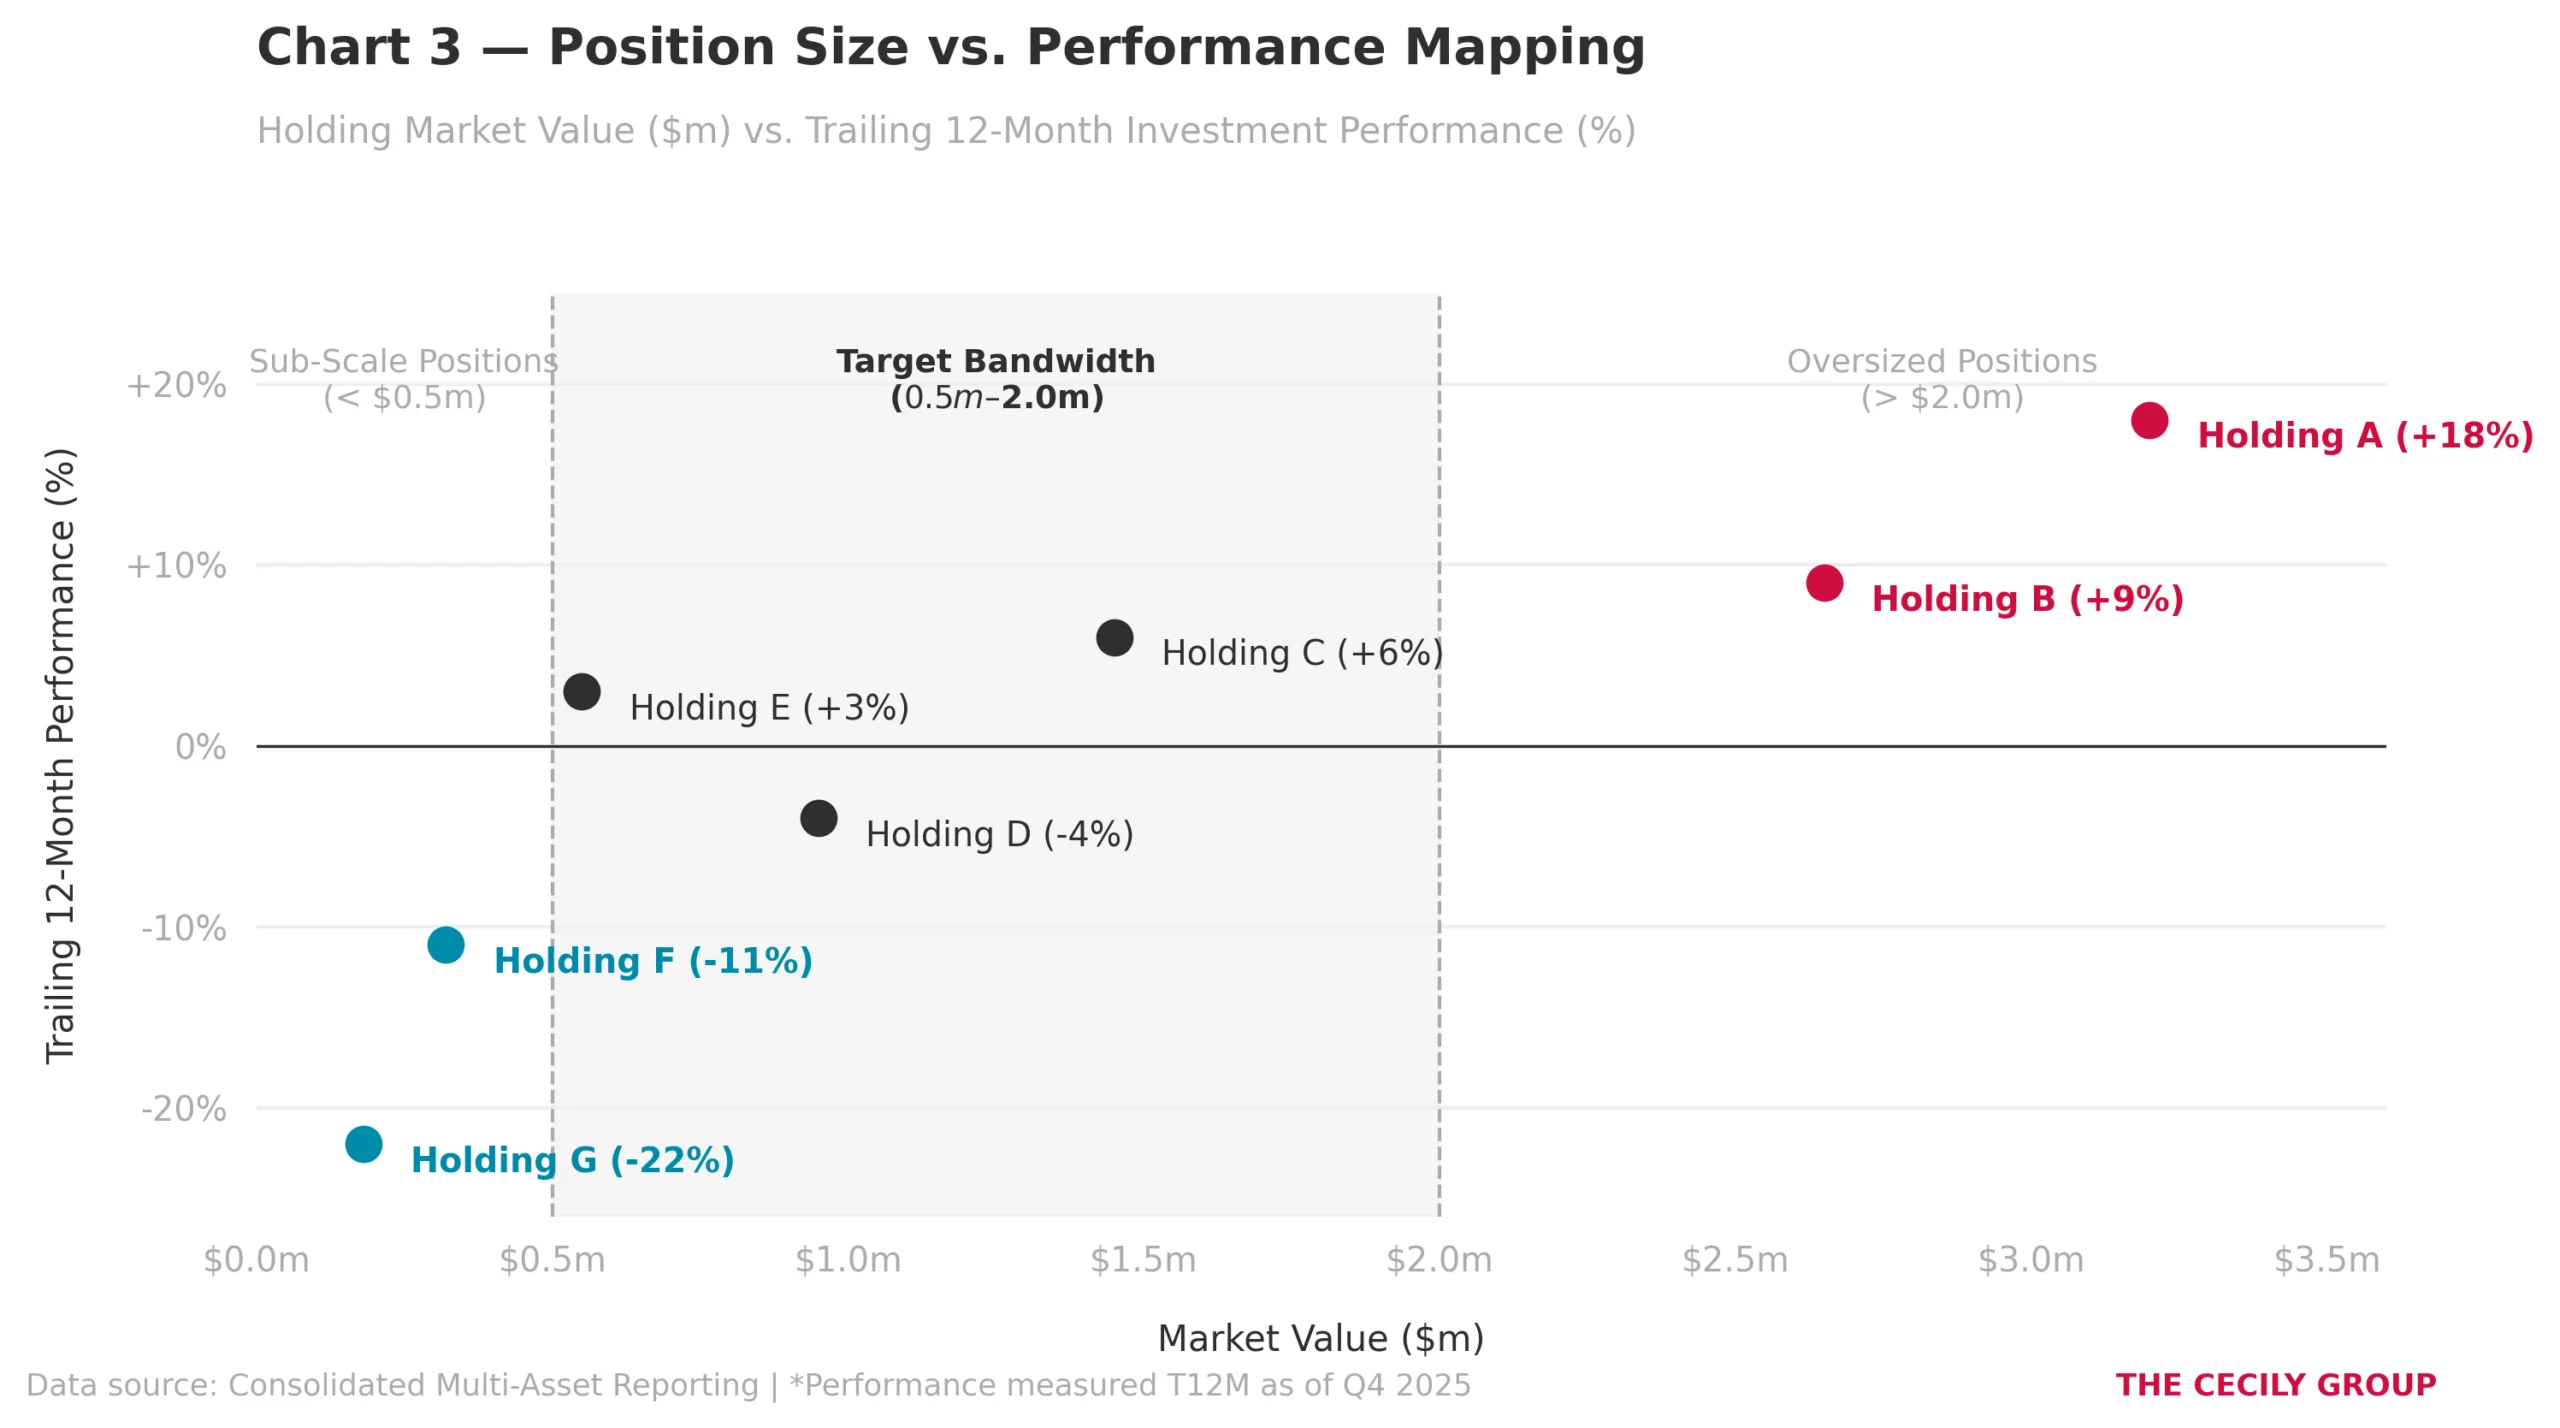
What it does: Plots individual holdings by current market value and investment performance, allowing position size and recent performance to be assessed together.
Required inputs: Individual holdings, current market values and performance over a consistent measurement period.
What it reveals: Whether weak performers have contracted into sub-scale positions, whether successful holdings have grown beyond the intended range, and where exceptions to the sizing framework are concentrated.
Why it matters: Position size viewed alone shows the current allocation. Adding performance provides context for how that allocation may have developed and identifies holdings that warrant further examination.
Subtleties & Limitations:
Association does not establish cause. A small position with poor performance may have shrunk because of losses, but it may also have been deliberately reduced. Likewise, an oversized position may reflect appreciation or an intentional allocation decision. The chart identifies positions for investigation; it does not establish how they reached their current size.
Performance-period sensitivity. The relationship between size and performance depends on the period selected. A YTD or 180-day measure provides useful context but cannot establish the full history of an investment decision.
These analyses examine how capital is actually distributed. Position Sizing Bandwidth establishes the intended range, Position Distribution Analysis shows how much of the portfolio sits outside it, and Market Value vs. Performance Mapping identifies the individual holdings behind those deviations.
Position sizing, however, captures only one dimension of diversification. The diversification benefit of a holding also depends on how it behaves in relation to the rest of the portfolio. Two appropriately sized positions that are strongly positively correlated may reinforce the same risks, while negatively correlated holdings can help offset them.
4. Correlation and Unsystematic Risk
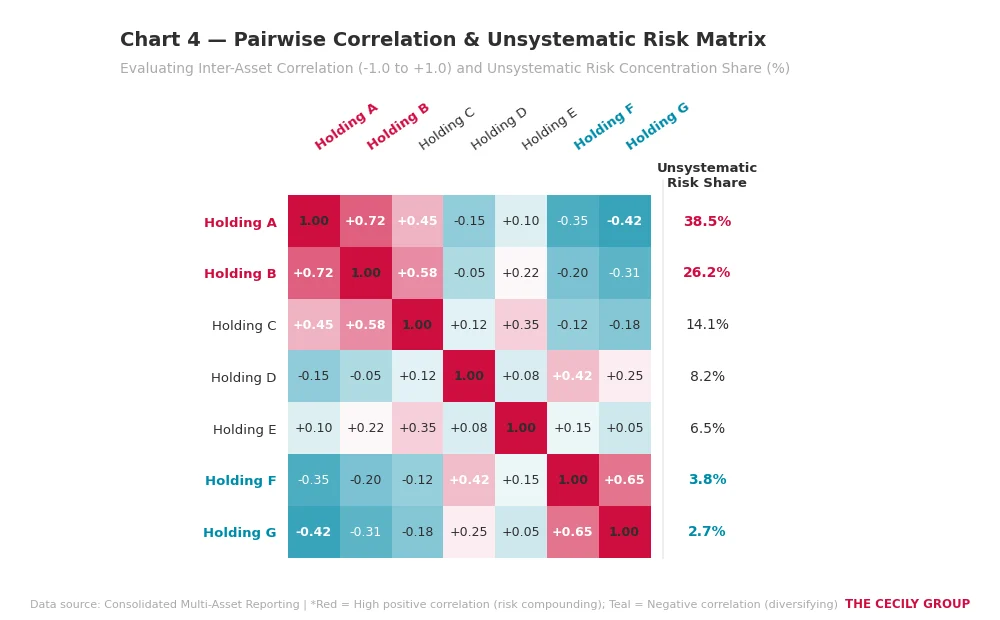
Pairwise correlation analysis can provide an additional perspective. In the illustrative example, Holdings A and B are among the largest positions and have a correlation of +0.72. Their combination of position weight, individual volatility and correlation results in a substantial share of the portfolio’s unsystematic risk. By contrast, Holding G is negatively correlated with Holding A at −0.42, which may provide a diversification benefit. At only 0.2% of the portfolio, however, its position is too small to provide a meaningful offset to the larger concentration.
This illustrates why position size and correlation need to be considered together. A portfolio may contain many holdings, including negatively correlated investments, while still deriving much of its portfolio-specific risk from a small number of larger, positively correlated positions.
Chart 4 — Pairwise Correlation & Unsystematic Risk Matrix
What it does: Pairwise correlation shows whether holdings tend to move together or in different directions. Combining this with position weights and individual volatility can provide an additional indication of where portfolio-specific risk is concentrated.
Why it matters: A negatively correlated holding may provide limited diversification benefit if its position is too small, while large, positively correlated holdings can reinforce concentration risk.
Subtleties & Limitations:
Correlation changes over time. Historical relationships between holdings may not persist, particularly during periods of market stress.
The risk-share calculation is illustrative. The example combines position weight, volatility and correlation to demonstrate how these factors can interact.
From Diagnosis to Action
The investment committee should understand why positions outside the intended sizing range exist and whether that remains consistent with the portfolio’s objectives. Furthermore, the investment committee should understand how correlations between assets impact the resulting diversification effect.
Governance Implications
Manager accountability. Positions outside agreed sizing parameters require an investment rationale. For sub-scale holdings, the relevant question is whether the position is being built, retained for a defined reason or awaiting exit. For oversized holdings, the manager should be able to explain why the concentration remains appropriate and how the associated downside is being managed.
Mandate discipline. Position sizes can change substantially without a corresponding change in the investment mandate. Reviewing the distribution of capital against agreed boundaries helps committees identify where the portfolio has moved away from its intended structure.
Decision quality. Consolidated analysis matters when several managers hold parts of the family’s wealth. A position that appears proportionate within one mandate may look different when assessed against total family assets. Oversight therefore requires a portfolio view independent of individual manager reporting.
Steps to Take
- Define position-sizing boundaries. Establish minimum and maximum position parameters within the Investment Policy Statement, reflecting portfolio size, strategy and the characteristics of the underlying investments.
- Review positions outside the range. Require managers to explain why each material exception exists and whether the intended action is to increase, retain, reduce or exit the position.
- Examine the portfolio tail. Identify holdings that have remained below the minimum threshold and determine whether they still have sufficient economic significance to justify their place in the portfolio.
- Escalate material concentrations. Set a threshold above which individual positions require explicit investment committee review, so substantial concentrations remain deliberate governance decisions rather than the consequence of portfolio drift.
- Repeat the analysis across reporting periods. Track the position distribution consistently to distinguish temporary exceptions from holdings that remain outside the intended range over time.
Independent Reporting
Individual asset managers understand the rationale behind their own positions, but principals and trustees need a consolidated view to assess how those decisions interact across the family’s total portfolio. Without that perspective, position-level decisions can appear reasonable individually while producing a different risk structure in aggregate.
Independent reporting can identify concentrations, persistent sub-scale positions and unintended changes in portfolio structure early enough for decision-makers to respond. It provides the committee with a separate basis for questioning those exposures and holding managers accountable for deviations from the intended portfolio structure. For families delegating substantial investment authority, independent oversight should be treated as an essential part of effective governance.
Learn more about The Cecily Group’s independent financial reporting service.
Stay tuned as I continue unpacking our reporting methodology, and subscribe to our newsletter to follow the full Inside the Data series.
References:
Fabozzi, F.J., Markowitz, H.M. and Gupta, F. (2008) ‘Portfolio selection’, in Fabozzi, F.J. (ed.) Handbook of Finance. Hoboken, NJ: John Wiley & Sons. doi: 10.1002/9780470404324.hof002001.
Statman, M. (1987) ‘How many stocks make a diversified portfolio?’, Journal of Financial and Quantitative Analysis. Available at: https://doi.org/10.2307/2330969.
Swiss Financial Market Supervisory Authority (FINMA) (2023) ‘FINMA approves merger of UBS and Credit Suisse’, 19 March. Available at: https://www.finma.ch/en/news/2023/03/20230319-mm-cs-ubs.