

A broad portfolio benchmark can make sector-level risk difficult to see. Overall equity performance may remain relatively stable even while an individual sector experiences substantial relative weakness, particularly when gains elsewhere in the market offset its effect on the portfolio.
Broad benchmark return provides an incomplete picture of portfolio risk. It shows how the portfolio performed against the market overall, but gives limited information about what happened within individual sectors or how concentrated exposures contributed to the result.
The Cecily Group’s independent reporting consolidates portfolios across banks and managers and examines the underlying drivers of performance, helping investment committees identify exposures that aggregate portfolio returns may obscure.
When “Temporary Weakness” Becomes an Inadequate Explanation
When a sector moves beyond its historical performance range, the explanation often centres on why the weakness (or strength) should be temporary. Technology’s relative underperformance in early 2026 presents two particularly plausible arguments.
“This is an extreme historical outlier, so mean reversion is likely”
Extreme relative moves can reverse as valuations adjust and sentiment changes. But historical rarity does not establish that the conditions that created performance still apply. Changes in interest rates, earnings expectations, regulation or industry economics can sustain a sector re-rating well beyond the initial sell-off.
Technology remains a strategic long-term allocation”
Long-term exposure to themes such as artificial intelligence and cloud infrastructure may remain consistent with the investment strategy. Yet the strength of the long-term investment case does not remove the consequences of concentration. When one sector accounts for a substantial share of active risk, a severe relative decline can materially affect the portfolio even if the underlying companies remain attractive investments.
There is also an analytical problem with treating sector weakness as short-term noise. When returns diverge substantially across sectors, understanding the source of relative performance becomes particularly important (Mauboussin and Callahan, 2020).
How Concentration Builds Before Market Conditions Change
Sector concentration can develop gradually when a successful allocation grows alongside years of strong relative performance.
During an extended period of outperformance, rising valuations can increase a sector’s weight within market-capitalisation benchmarks. Active managers may also maintain or increase an overweight where they expect the underlying growth drivers to persist. Over time, what began as a deliberate allocation can become a much larger source of portfolio risk.
Broad benchmark return provides an incomplete picture of this change. A portfolio can stay close to its benchmark while substantial differences develop between the sectors underneath. Gains in some parts of the market can offset weakness elsewhere, making the aggregate result appear less significant than the underlying sector movements.
Relative return provides a more useful perspective. It measures the difference between an investment’s performance and that of a relevant benchmark. A sector can therefore deliver a positive absolute return while still detracting from relative portfolio performance.
Historical context adds another dimension. A quarterly return shows what happened during a particular period, but gives little indication of whether that outcome was ordinary or exceptional. Historical Percentile Distribution places current sector performance within the range of previous observations, helping identify when behaviour has moved towards the extremes of its historical distribution.
Differences between sectors also become more important when Cross-Sectional Return Dispersion is high. Dispersion measures the spread of returns across sectors or securities. When that spread widens, allocation decisions have greater potential to influence portfolio outcomes because different parts of the market are behaving very differently (Mauboussin and Callahan, 2020).
The vulnerability becomes more apparent when the conditions supporting the concentrated sector begin to change. Shifts in interest rates, earnings expectations, regulation or industry economics can alter the valuations investors are willing to pay. If the portfolio still carries the concentration accumulated during the previous period, sector weakness can feed directly into relative portfolio performance.
A concentrated, unhedged position built during a prolonged period of strength can become a source of substantial downside risk when the conditions supporting that strength change. Strong historical performance may have reinforced confidence in the allocation without revealing its vulnerability to a different market environment.
The dot-com collapse provides a historical example. After peaking in March 2000, the technology-heavy Nasdaq Composite fell nearly 80% by October 2002 (Williams, 2025). The episode illustrates how an extended period of sector strength can be followed by severe and sustained losses.
The reporting question is whether a strategic sector allocation remains consistent with the portfolio’s mandate when its behaviour moves beyond the conditions under which that allocation was established.
Detecting When Sector Performance Leaves Its Historical Range
A headline portfolio return can identify that performance has changed. It cannot show whether the change reflects ordinary market movement, an unusually weak sector, or a concentrated active position. The analyses below provide that context by moving from the sector’s relative performance to its historical position and, finally, its contribution to portfolio results.
1. Active Sector Return
What it does: Measures the performance difference between a sector and its relevant market benchmark over the same period.
Required inputs: Sector returns, benchmark returns and a consistent measurement period.
What it reveals: Whether the sector is adding to or detracting from performance relative to the rest of the market. This distinction matters because positive absolute returns can coexist with substantial relative underperformance.
Why it matters: It prevents an investment committee from interpreting the direction of the sector return as evidence that the allocation is fulfilling its intended role. A sector may still be rising while becoming a significant source of relative drag.
Subtleties & Limitations:
Benchmark selection. The result depends on the benchmark used. Comparing technology with World ex-TMT isolates the sector effect, while comparison with a broad index answers a different question.
Relative rather than absolute risk. Relative return identifies divergence from the benchmark but does not establish the scale of absolute capital loss.
2. Historical Percentile Distribution
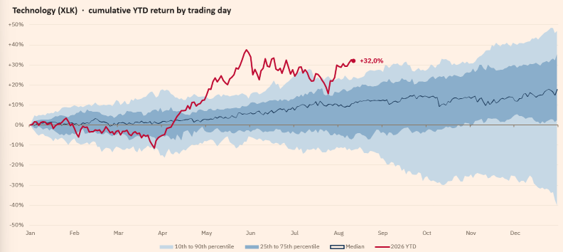
What it does: Places the current relative-return trajectory within the historical distribution of previous observations. The Goldman Sachs analysis uses top and bottom deciles, quartiles and the median across data beginning in 1973 (Goldman Sachs, 2026).
Required inputs: A sufficiently long history of comparable sector-relative returns and the current return trajectory.
What it reveals: Whether current performance falls within historically common ranges or has moved towards the tails of the distribution. Goldman Sachs’ historical analysis places World Technology’s 2026 relative-return trajectory below the historical bottom-decile range by March.
Why it matters: A quarterly loss viewed in isolation provides little indication of how unusual it is. Historical percentile positioning distinguishes an ordinary period of underperformance from an outcome rarely observed in the historical record.
Subtleties & Limitations:
Historical dependence. Percentiles describe what occurred within the observation period. They do not define the full range of possible future outcomes.
No prediction of reversal. Moving into the bottom decile does not imply that performance is about to recover. The analysis identifies an extreme observation, not its duration.
3. Cross-Sectional Return Dispersion
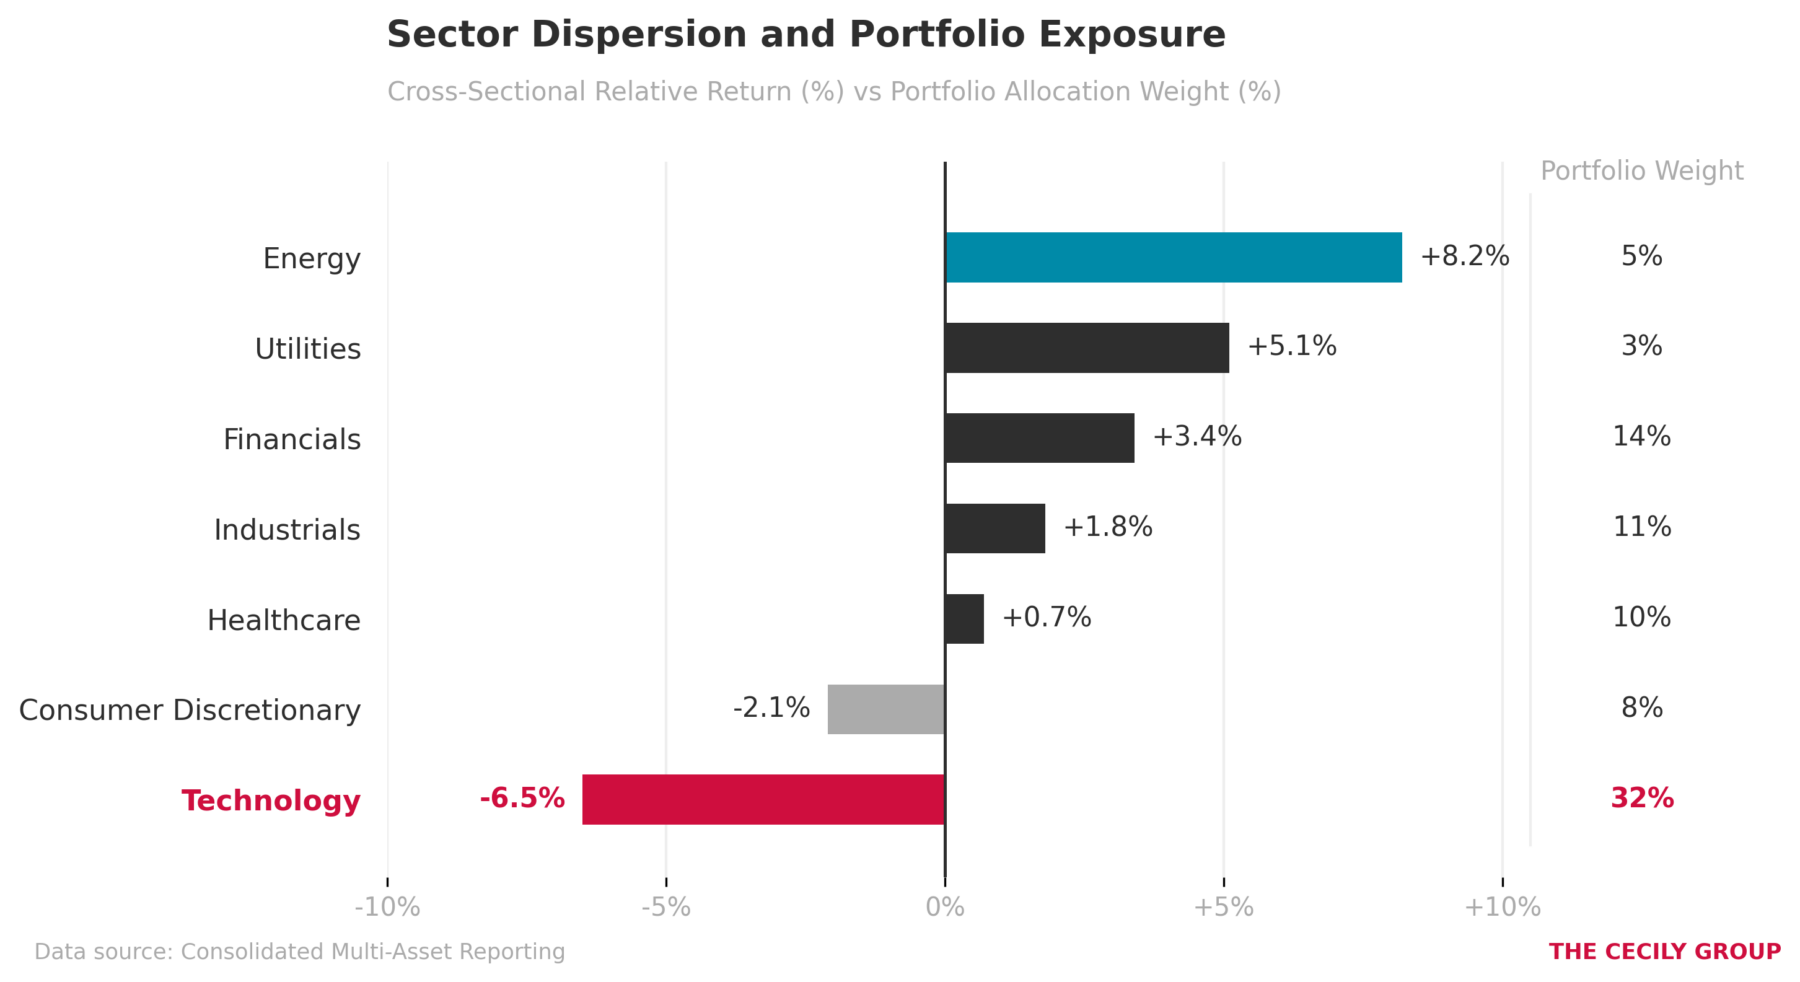
What it does: Measures the spread of returns across sectors or assets within the market.
Required inputs: Comparable returns across the relevant sectors or securities for the same measurement period.
What it reveals: Whether apparently stable market performance contains substantial divergence underneath. A broad equity index can show a modest movement while individual sectors experience much larger gains and losses.
Why it matters: High dispersion increases the significance of allocation decisions. When sectors behave very differently, the portfolio’s result can depend heavily on where capital is concentrated. Mauboussin (2020) links dispersion to the opportunity set for active management, making it particularly relevant when assessing whether active decisions are driving outcomes.
Subtleties & Limitations:
Dispersion does not identify cause. A wide spread shows that sector outcomes differ materially, but does not establish whether those differences result from fundamentals, valuation changes or other market forces.
Portfolio exposure is separate. Market dispersion alone does not show how strongly the family is exposed to the sectors producing those extremes.
4. Tracking Error and Sector Attribution
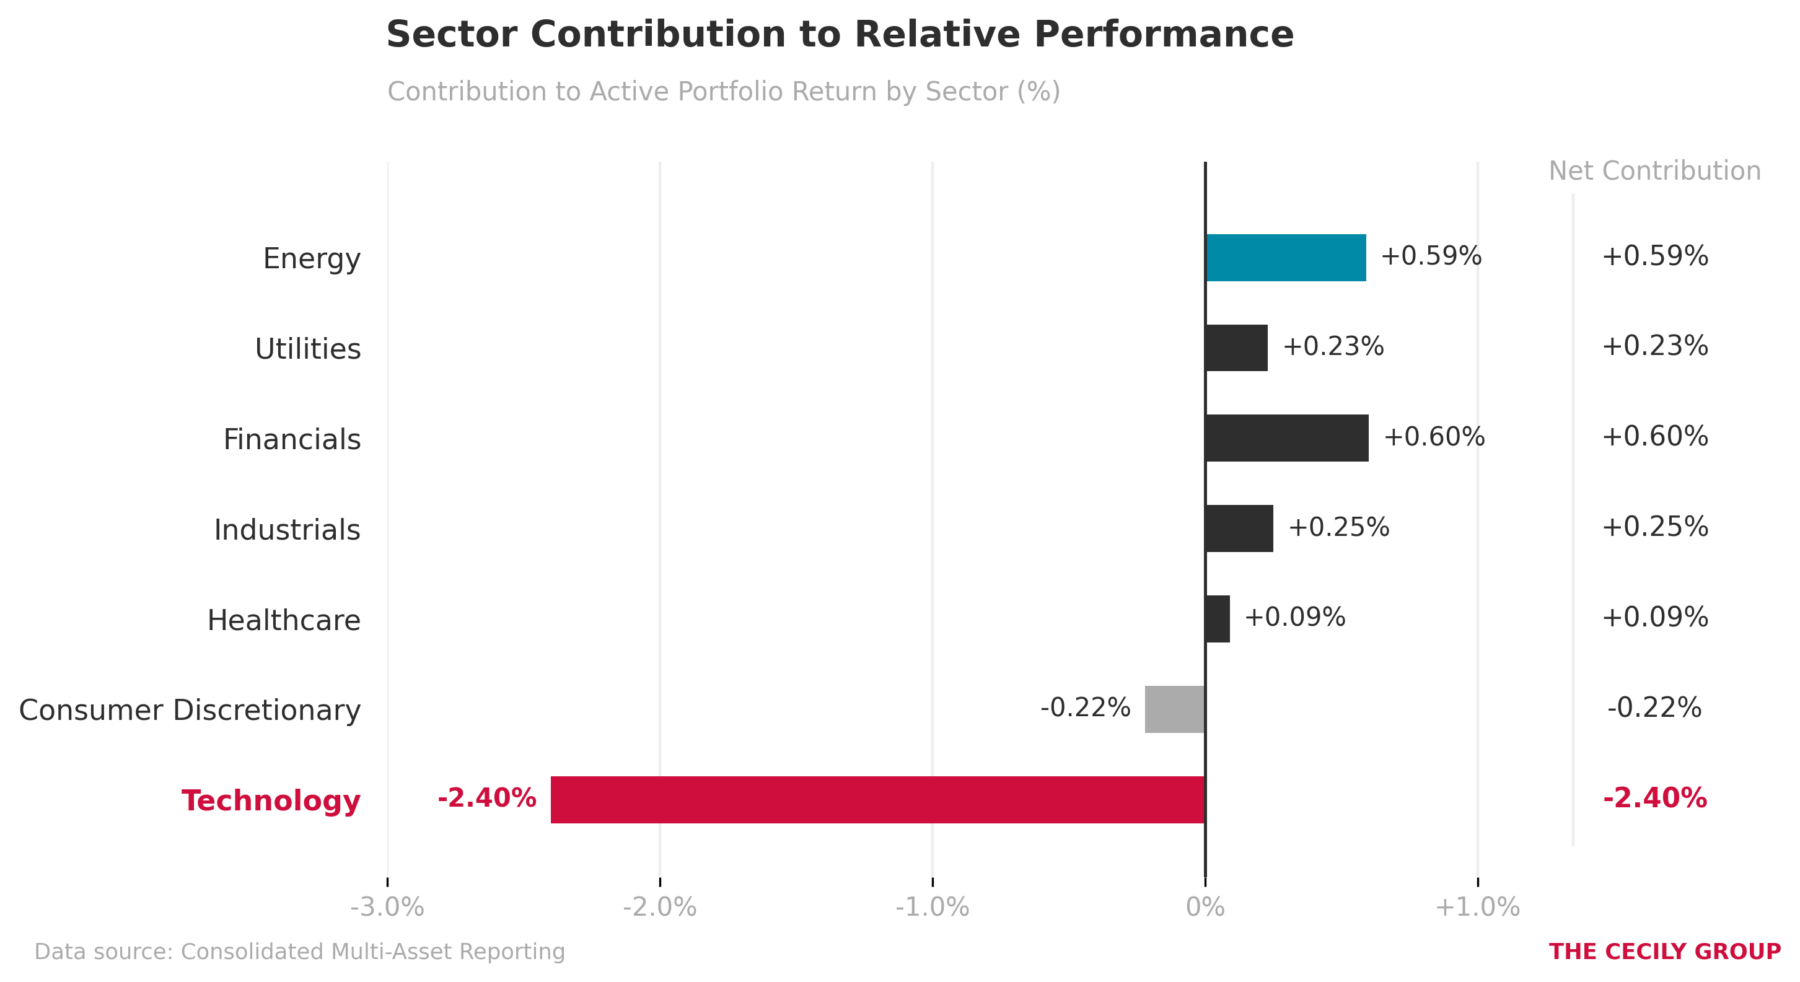
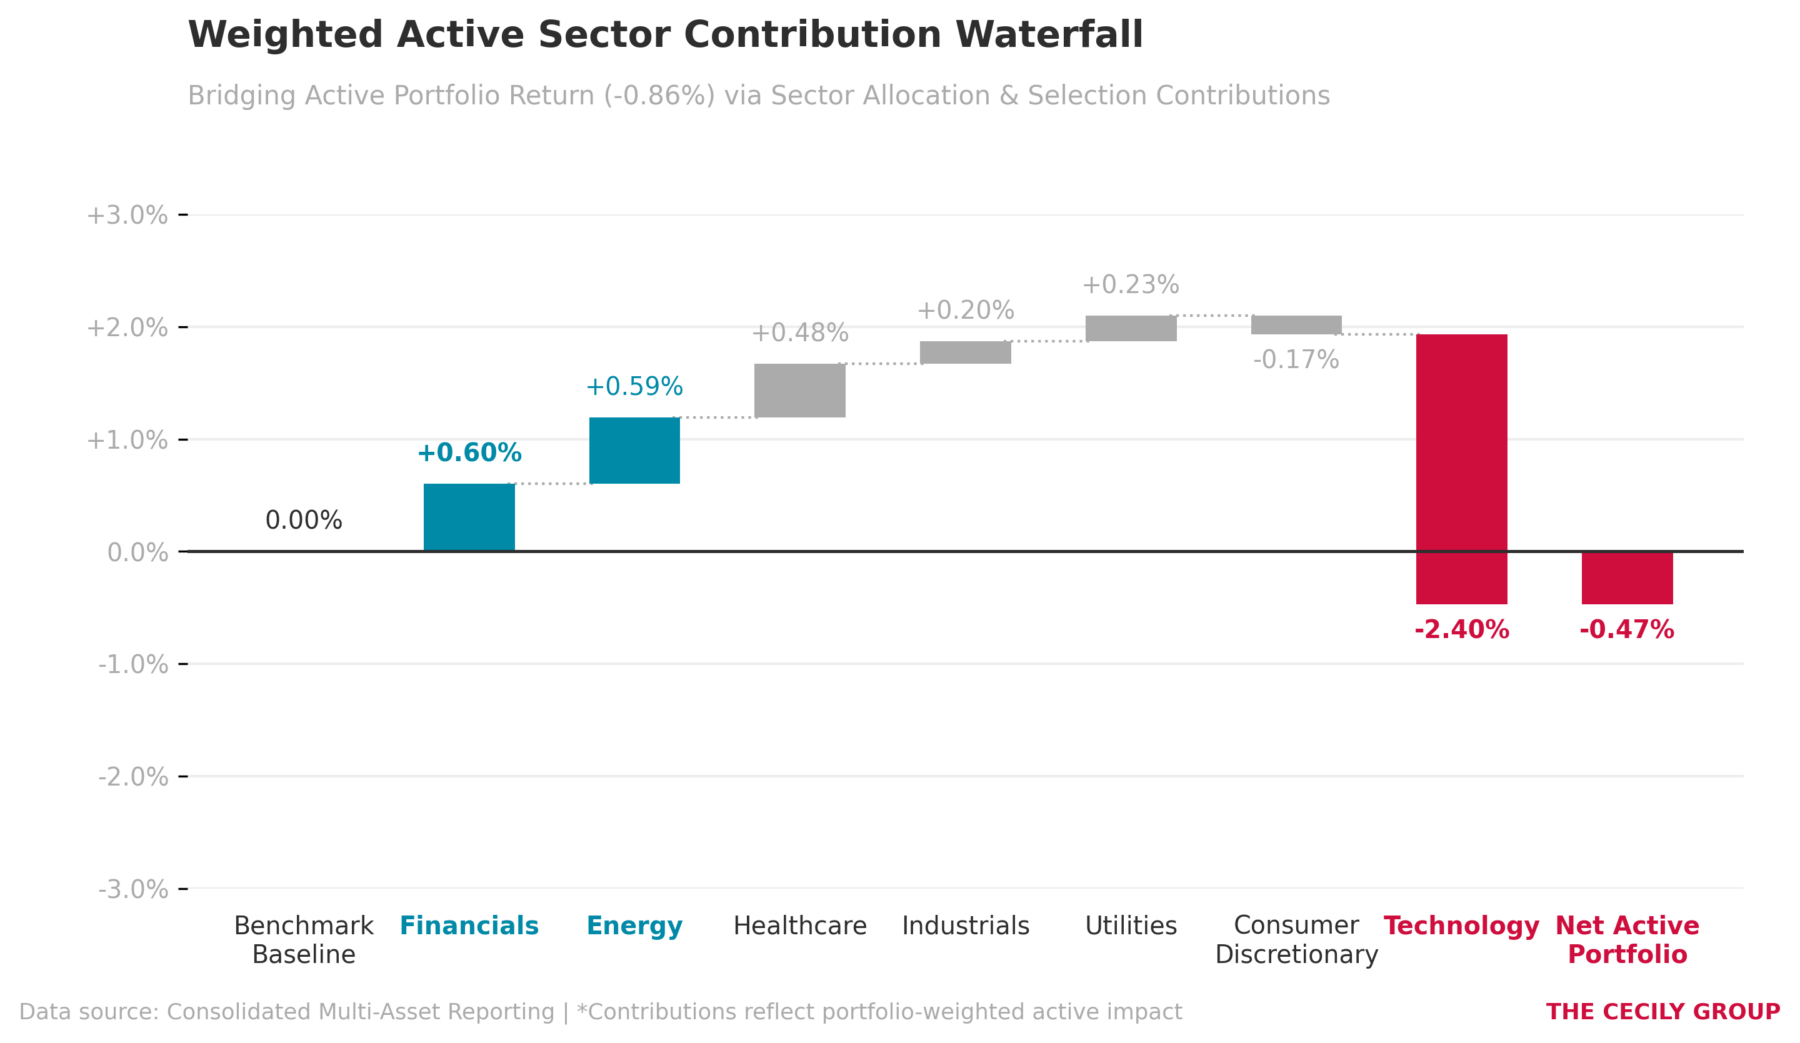
What it does: Tracking error measures the variability of portfolio returns relative to a benchmark, while attribution separates the contribution of allocation and investment-selection decisions. Sector-allocation tracking error can help distinguish the effect of sector exposure from active security selection.
Required inputs: Portfolio holdings and returns, benchmark composition and returns, sector classifications and consistent time-series data.
What it reveals: Whether underperformance primarily reflects a sector overweight or the securities selected within that sector. It therefore connects the market-level warning signal to the manager’s actual decisions.
Why it matters: Once technology enters an historically extreme relative-performance range, the governance question becomes portfolio-specific. Attribution can show how much of the family’s result came from maintaining the sector exposure and how much came from decisions made within it.
Subtleties & Limitations:
Model sensitivity. Attribution depends on the benchmark, classification system and methodology used. Different choices can allocate responsibility differently between sector positioning and security selection.
Tracking error is not a judgement of quality. A high or low figure describes deviation from the benchmark. It does not establish whether the active decisions producing that deviation were appropriate.
The same analysis can be applied wherever a portfolio carries a meaningful sector tilt and current performance begins to depart from its historical range. The four analyses answer different parts of the same governance question. Active Sector Return identifies the divergence. Historical Percentile Distribution establishes how unusual it is. Cross-Sectional Return Dispersion shows what may be concealed beneath the aggregate market result. Tracking Error and Sector Attribution connect that market behaviour to the portfolio and the manager’s decisions. They distinguish a difficult quarter from a portfolio exposure that warrants governance attention.
Turning an Extreme Sector Signal into a Governance Decision
An extreme relative-performance signal warrants a governance review rather than an automatic investment decision. The committee needs to confirm whether the exposure is intentional, whether the associated risk is still acceptable, and whether the manager’s decisions remain consistent with the mandate.
Governance Implications
Manager accountability. When a sector moves towards the extremes of its historical performance range, the explanation often centres on why the weakness should be temporary. The manager should be able to distinguish the effect of sector allocation from security selection and explain the conditions under which the position would be reduced, rebalanced or reconsidered.
Mandate discipline. A strategic allocation can gradually become a concentration without any explicit decision to increase risk. Investment committees therefore need to assess current exposures against the portfolio’s stated objectives and risk parameters, rather than treating past allocation decisions as continuing approval.
Decision quality. Trustees and family council members depend on information supplied by managers who possess deeper knowledge of their own portfolios. Research on corporate governance finds that information problems can constrain the ability of outside directors to monitor management effectively (Armstrong et al., 2016). The same underlying information asymmetry matters in investment oversight: decision-makers need sufficiently independent information to challenge the explanation they receive.
Steps to Take
- Quantify the sector exposure. Establish the portfolio’s current technology/TMT weight and its active weight relative to the agreed benchmark. The committee should know how much of the exposure comes from deliberate allocation decisions and how much has accumulated through market movements.
- Put current performance in historical context. Review the sector’s relative-return trajectory against its historical percentile distribution. A move into an extreme range should trigger examination rather than an automatic trading decision.
- Attribute the portfolio impact. Separate the contribution of sector allocation from active security selection. This establishes whether recent underperformance primarily reflects the decision to maintain the sector overweight or the investments selected within it.
- Test the manager’s decision rules. Ask what fundamental, valuation or earnings conditions would cause the manager to reconsider the allocation. The purpose is to establish whether the position remains governed by defined criteria rather than by an expectation that previous performance will eventually return.
- Set a formal review trigger. Define conditions within the Investment Policy Statement that require the committee to review a concentrated sector exposure. Historically extreme relative performance could provide one such trigger. The threshold should initiate a review rather than predetermine the investment decision.
Independent Reporting
The underlying governance problem is information asymmetry. Asset managers possess detailed information about their positioning, assumptions and investment decisions, while principals and trustees often receive the resulting performance through reports prepared by those same managers. Research on transparency and governance indicates that access to reliable financial information supports principals and boards in assessing agent decisions (Armstrong et al., 2016).
Independent reporting helps identify concentrations, unexplained performance drivers and emerging risks early enough for decision-makers to question them. The benefit may therefore appear as a loss avoided, an exposure reconsidered or a decision made with fuller information. For families delegating substantial investment authority, independent oversight should be treated as an essential part of effective governance.
Learn more about The Cecily Group’s independent financial reporting service.
Stay tuned as I continue unpacking our reporting methodology, and subscribe to our newsletter to follow the full Inside the Data series.
References:
Armstrong, C.S., Guay, W.R., Mehran, H. and Weber, J.P. (2016) ‘The role of financial reporting and transparency in corporate governance’, Economic Policy Review, 22(1), pp. 107–128. Available at: https://www.newyorkfed.org/medialibrary/media/research/epr/2016/epr_2016_post-crisis-proposal_armstrong.pdf
Goldman Sachs (2026) ‘Are technology stocks cheap now?’, Goldman Sachs. Available at: Goldman Sachs – Are Technology Stocks Cheap Now?. Available at: https://www.goldmansachs.com/insights/articles/are-technology-stocks-cheap-now
Williams, W. (2025) ‘Timeline of U.S. stock market crashes’, Investopedia. Available at: https://www.investopedia.com/timeline-of-stock-market-crashes-5217820
Grinold, R.C. and Kahn, R.N. (2000) Active Portfolio Management: A Quantitative Approach for Producing Superior Returns and Controlling Risk. 2nd edn. New York: McGraw-Hill. Available at: https://cms.dm.uba.ar/academico/materias/2docuat2016/analisis_cuantitativo_en_finanzas/Richard%20Grinold%2C%20Ronald%20Kahn-Active%20Portfolio%20Management_%20A%20Quantitative%20Approach%20for%20Producing%20Superior%20Returns%20and%20Controlling%20Risk-McGraw-Hill%20%281999%29.pdf
Mauboussin, M.J. and Callahan, D. (2020) Dispersion and Alpha Conversion: How Dispersion Creates the Opportunity to Express Skill. Consilient Observer, Counterpoint Global Insights. Morgan Stanley Investment Management. Available at: https://www.morganstanley.com/im/en-us/institutional-investor/insights/consilient-observer/dispersion-and-alpha-conversion.html