
A portfolio can appear well protected against losses until markets move beyond the assumptions built into its risk model.
Value at Risk (VaR) is often used to summarise downside exposure in a single monetary figure. This makes the measure a simple-to-understand and useful metric for monitoring risk across a multi-asset portfolio. But its simplicity can obscure what the measure leaves unanswered. VaR identifies a loss threshold at a chosen confidence level and time horizon. At the same time, it does not tell a committee how severe losses may become once that threshold has been crossed and reality starts to bite.
When a Risk Measure Becomes a Risk Boundary
Extreme market movements do not necessarily behave according to the assumptions behind conventional risk models. Extreme outcomes (“Black Swans”) can occur with greater frequency than a normal distribution would imply. Correlations between assets can also change materially during periods of market stress.
This matters because committees govern through the information produced by those models. A single downside-risk figure compresses different exposures, liquidity characteristics and market relationships into one metric. The resulting dashboard may look comprehensive while leaving the committee with little information about what happens outside the modelled range.
For families whose assets are spread across managers, banks and investment structures, the problem can become harder to see. Individual mandate reports provide only partial views, while meaningful risk analysis depends on consistent consolidation across the wider portfolio. The Cecily Group’s independent reporting combines transaction-level consolidation with cross-manager analysis to give decision-makers a unified basis for oversight.
The Manager’s Defence
A low VaR figure can be a useful indicator of risk under the conditions captured by the model. The problem arises when it is treated as sufficient evidence that downside exposure is under control.
“The model shows that downside risk is contained”
VaR estimates a loss threshold at a specified confidence level; it does not measure how severe losses may become beyond that threshold. A portfolio can therefore remain within its stated risk parameters while the model provides limited information about the outcomes that matter most.
“Diversification protects the portfolio”
Diversification depends partly on the relationships between assets remaining sufficiently distinct. During systemic stress, those relationships can change: assets that behaved differently in ordinary markets may decline together, weakening the protection implied by historical correlations.
“Historical data gives us an objective basis for estimating risk”
Historical data is essential to risk modelling, but a model based primarily on observed volatility can understate outcomes that occur infrequently or under different market conditions.
Research on corporate governance finds that information problems can limit the effectiveness of outside directors by increasing the difficulty and cost of assessing management decisions (Armstrong et al., 2010).
The relevant question for an investment committee is therefore: what happens to the portfolio when the assumptions behind its headline risk measure stop holding?
How Risk Models Fail Under Stress
VaR becomes less informative precisely where governance scrutiny becomes most important: beyond the confidence threshold.
A conventional VaR estimate answers a specific question. At a given confidence level and over a defined period, it estimates a loss threshold that should only be exceeded with a specified probability.
From Normal Markets to Fat Tails
Many standard risk models rely on assumptions derived from the historical distribution of returns. A normal distribution places progressively lower probabilities on outcomes further from the average.
Financial markets do not consistently behave this way. Returns can exhibit fat tails, meaning extreme outcomes occur more frequently than a normal distribution would suggest. A risk estimate calibrated predominantly to ordinary market behaviour can therefore assign very low probabilities to events that remain economically significant (Longin, 2000).
This creates an important distinction between probability and severity. A committee may know how likely a threshold is to be exceeded without knowing how severe the losses could become beyond it.
Diversification Can Change Under Stress
The second problem concerns correlation. Portfolio diversification relies on assets responding differently to market conditions. When correlations are low or negative, losses in one part of the portfolio may be offset by stability or gains elsewhere.
During systemic shocks, these relationships can change. Assets that appeared weakly correlated under ordinary conditions may begin moving in the same direction. The diversification visible in historical data can then provide less protection when it is most needed (Longin and Solnik, 2001).
This is where the central governance issue emerges: a risk measure designed to estimate losses under modelled conditions can become a de facto risk boundary in committee decision-making, even though the portfolio’s behaviour beyond that boundary remains largely unmeasured.
A precise measure of one part of the loss distribution can therefore be mistaken for a complete picture of portfolio risk.
Liquidity Can Amplify the Problem
Market losses can also interact with liquidity. During periods of stress, a family may need cash for spending requirements, commitments, or capital calls while some investments cannot be sold readily. If private or alternative investments restrict redemptions when public assets decline, the portfolio’s available liquidity can become concentrated in assets already under pressure. If access to private or alternative investments becomes restricted while public assets decline, liquidity may become concentrated in assets that are already under pressure.
The consequence is not captured fully by looking at price risk and liquidity separately. A portfolio can face falling asset values, rising correlations and reduced access to capital at the same time.
Consider a hypothetical diversified family portfolio with a relatively low reported VaR. A severe market shock causes equities and credit to fall together, while several private investments restrict redemptions. The family must still meet existing cash requirements. In such a case, the question is whether the committee understood the losses and liquidity constraints that could arise.
This is why the distinction between ordinary risk measurement and stress analysis matters. Expected Shortfall estimates the severity of losses beyond the VaR threshold. Historical Drawdown Replays estimate how today’s portfolio would have responded to previous market crises, while Scenario-Based Stress Testing examines its potential response to hypothetical combinations of adverse conditions
Detection
The analyses below address different parts of the problem: the expected loss boundary, the severity of losses beyond it, the portfolio’s behaviour during previous crises, and its response when several adverse conditions occur together.
1. Value at Risk (VaR)

Illustrative Chart — Value at Risk by Asset Class
What it does: VaR estimates the loss threshold a portfolio is expected to exceed only with a specified probability over a defined period. It provides a standardised measure of downside risk that can be monitored across reporting periods.
Required inputs: Portfolio positions, historical return or volatility data, correlations between assets, a selected confidence level and a defined time horizon.
What it reveals: VaR provides a concise indication of the portfolio’s modelled downside exposure under the assumptions used in the calculation.
Why it matters: It gives committees a consistent reference point for monitoring changes in portfolio risk. Its governance value depends on recognising exactly what the figure measures.
Subtleties & Limitations: VaR does not quantify the severity of losses beyond its confidence threshold. Where the methodology relies on normal-distribution assumptions and stable historical correlations, it can also underrepresent extreme market behaviour.
2. Expected Shortfall (Conditional VaR)
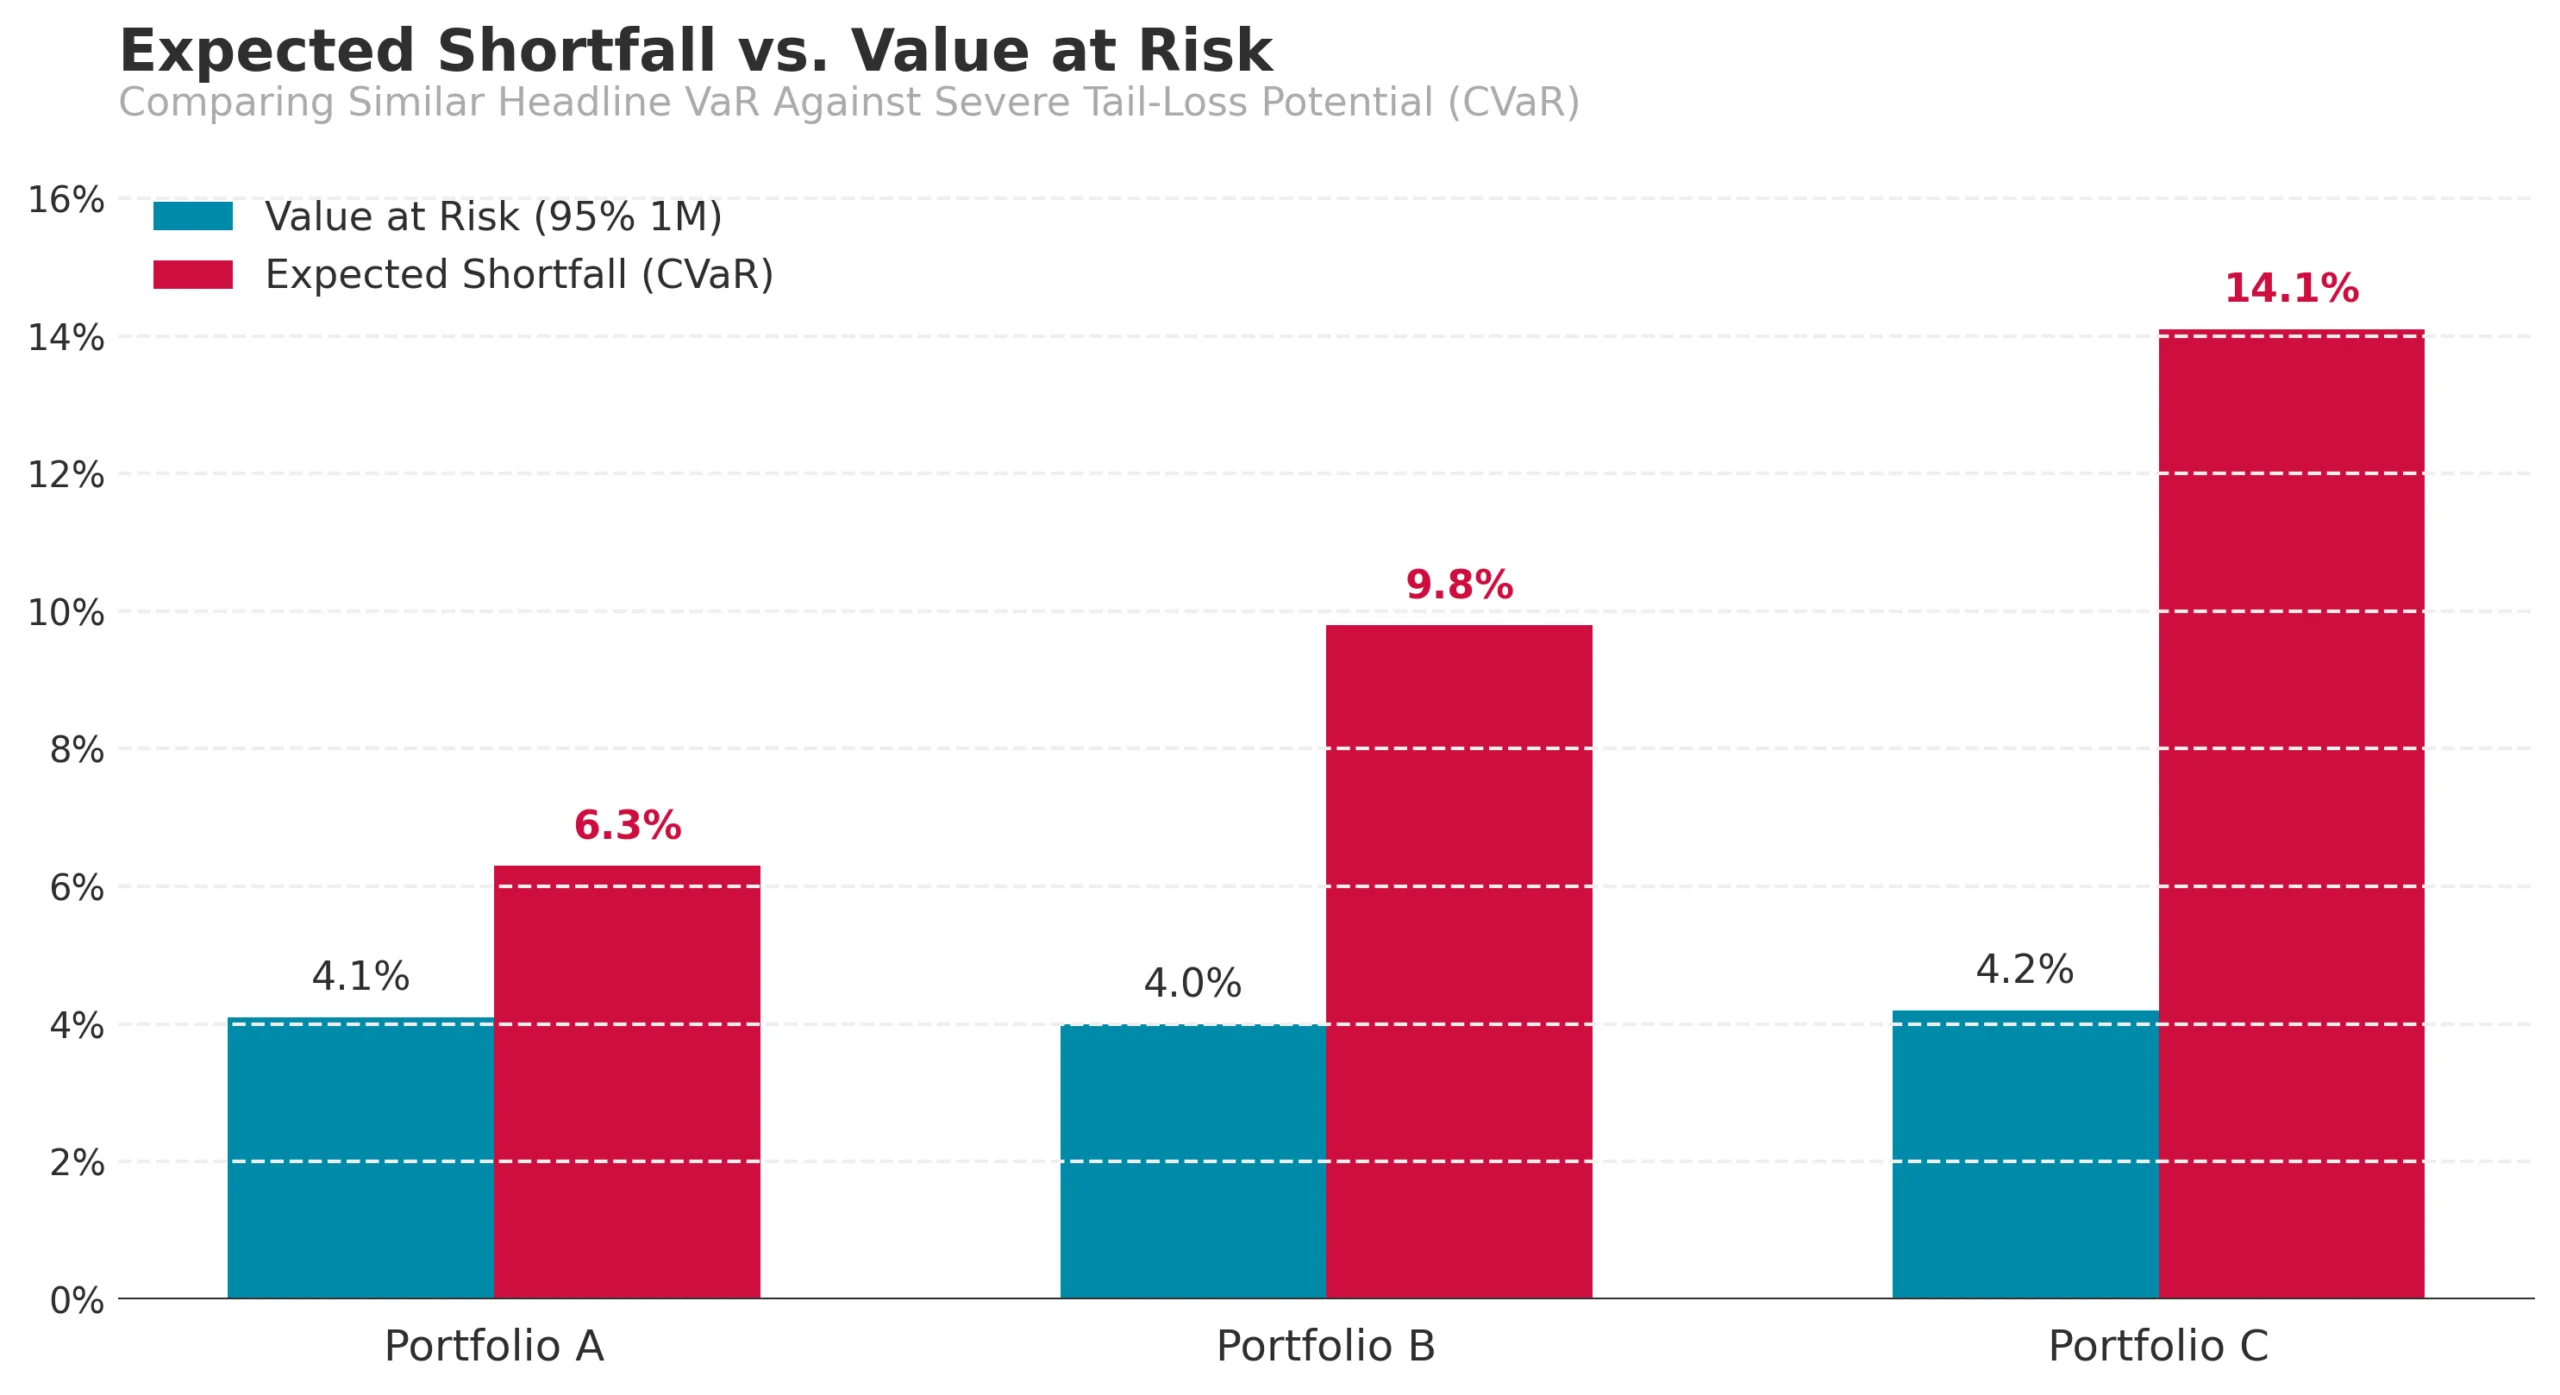
Illustrative Chart — Expected Shortfall
What it does: Expected Shortfall, also known as Conditional VaR, estimates the average loss once the VaR threshold has been exceeded. It moves the analysis from the probability of crossing a loss threshold to the potential severity of losses in the tail of the distribution (Yamai and Yoshiba, 2005).
Required inputs: The portfolio exposures and loss distribution used for risk modelling, together with the selected confidence level and time horizon.
What it reveals: It shows how damaging the outcomes beyond the VaR boundary could be on average.
Why it matters: Two portfolios can present similar VaR figures while carrying materially different losses beyond that threshold. Expected Shortfall gives committees information about a part of the risk distribution that VaR alone leaves unmeasured.
Subtleties & Limitations: Expected Shortfall remains model-dependent. Its usefulness therefore depends on the assumptions used to construct the loss distribution and does not remove the need to examine scenarios outside historical patterns.
3. Historical Drawdown Replays
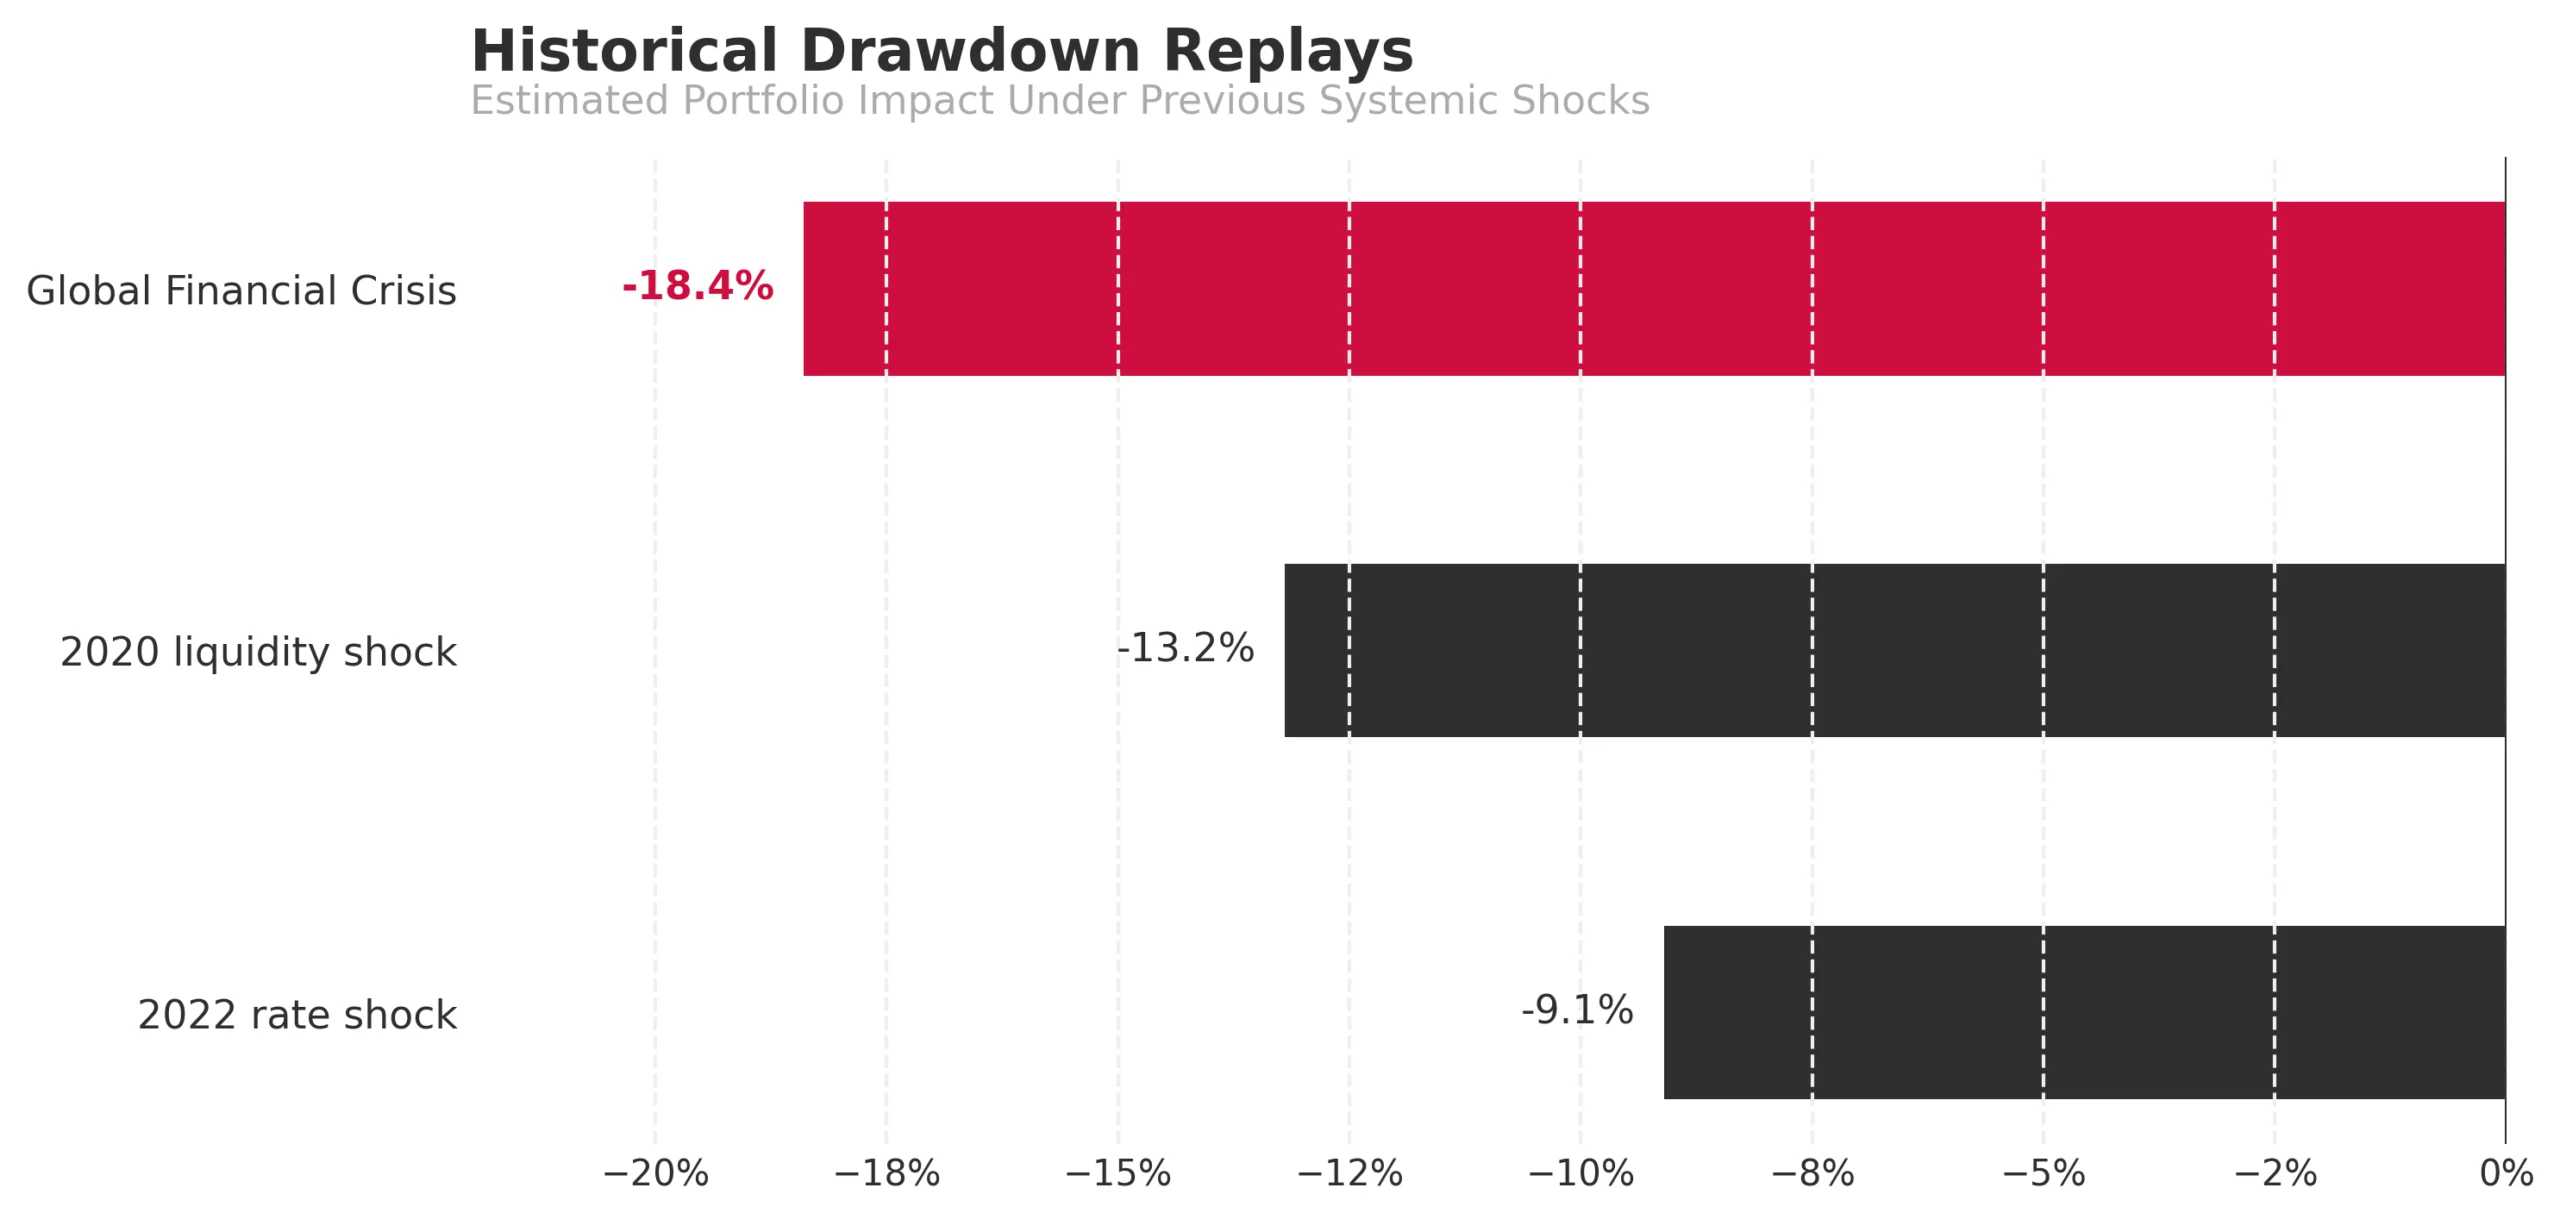
Illustrative Chart — Historical Drawdown Replays
What it does: Historical Drawdown Replays estimate how the current portfolio would have performed during previous periods of severe market stress. They apply historical market movements to today’s portfolio exposures, without requiring the portfolio to have existed during those events.
Required inputs: Current portfolio exposures and historical market movements across the relevant asset classes and risk factors. A documented history of the portfolio itself is not required.
What it reveals: The analysis translates a historical crisis into an estimated impact on the current portfolio, exposing vulnerabilities that may remain muted in ordinary volatility measures.
Why it matters: For an investment committee, an estimated drawdown under recognisable crisis conditions can make tail exposure easier to interrogate than an abstract probability alone.
Subtleties & Limitations: Historical replays are limited to market conditions that have already occurred. Their results are estimates based on current exposures rather than records of actual portfolio losses. They cannot establish how the next crisis will develop.
4. Scenario-Based Stress Testing
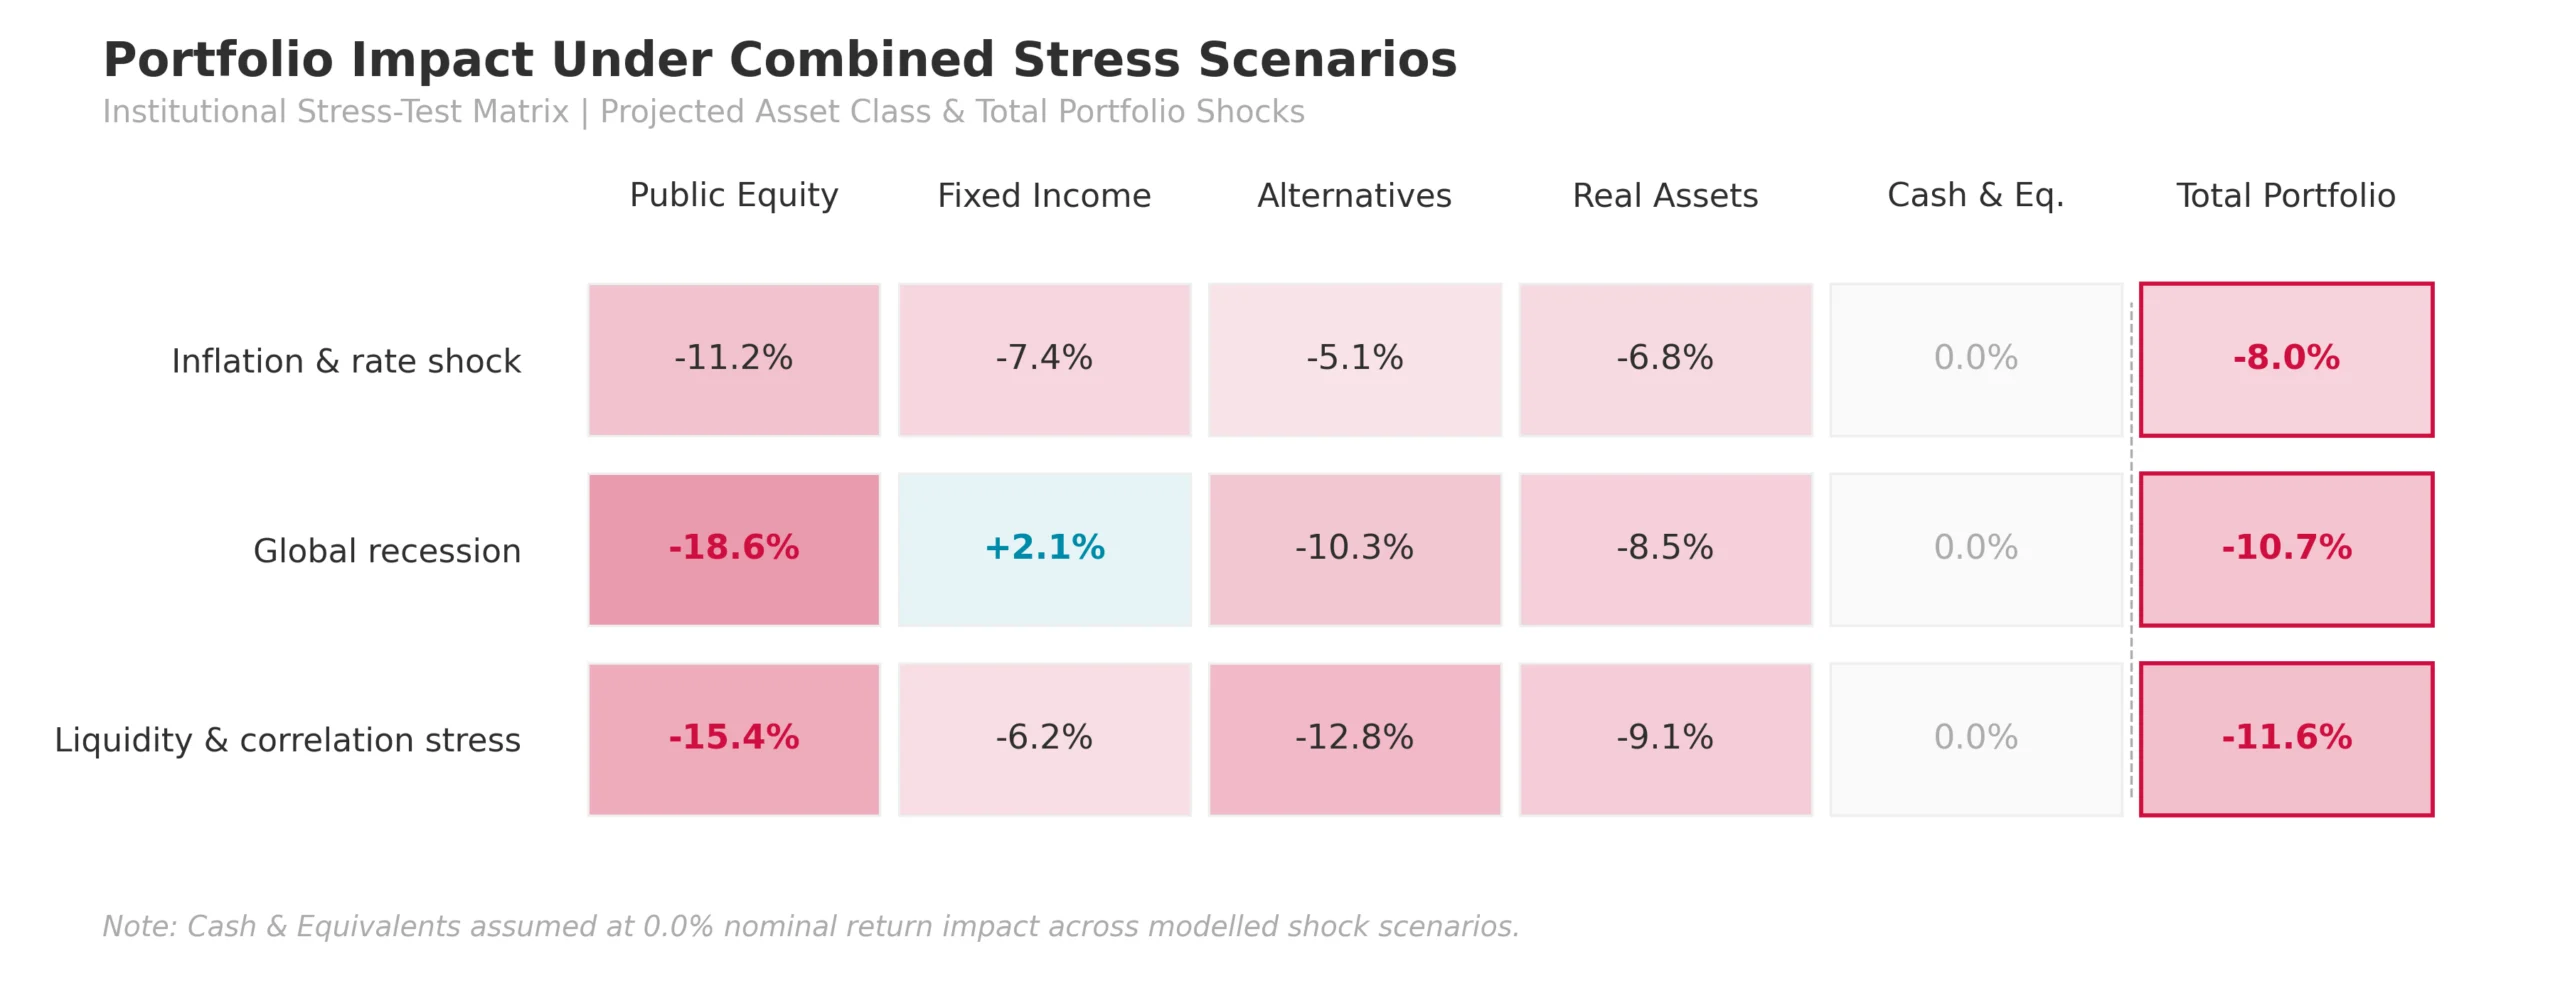
Illustrative Chart — Portfolio Impact Under Combined Stress Scenarios
What it does: Scenario-Based Stress Testing estimates how the current portfolio might respond to hypothetical combinations of adverse conditions, including market shocks, currency movements and liquidity restrictions. Unlike historical replays, these scenarios can examine conditions that have not previously occurred together.
Required inputs: Current portfolio exposures together with explicit assumptions about changes in relevant market variables, asset relationships and liquidity conditions.
What it reveals: Stress testing can identify vulnerabilities created by interactions between risks that appear manageable when considered separately.
Why it matters: This moves committee oversight beyond the question of how the portfolio behaved historically. It allows decision-makers to examine whether the portfolio remains viable under conditions that are plausible but absent from the historical sample.
Subtleties & Limitations: Stress-test results depend heavily on scenario design. A portfolio passing one scenario does not demonstrate resilience to risks that were excluded from it.
A single analysis can not establish whether a portfolio is resilient to severe market stress. VaR estimates the loss boundary under modelled conditions, while Expected Shortfall examines the severity of losses beyond it. Historical Drawdown Replays test current exposures against market conditions that have already occurred, while Scenario-Based Stress Testing explores combinations of adverse conditions that may not exist in the historical record. Together, they allow committees to distinguish between modelled downside risk, tail-loss severity, historical vulnerability and exposure to plausible future stresses.
The results still depend on the assumptions, historical data and scenarios used, so they should inform judgement rather than be treated as predictions of future losses.
From Diagnosis to Action
Risk measures are useful only when committees understand what each measure captures and what remains outside it. The governance task is to prevent a concise dashboard metric from becoming a substitute for examining the portfolio under adverse conditions.
Governance Implications
Risk tolerance must extend beyond probability. A committee that approves a risk limit expressed through VaR has defined how frequently a threshold may be exceeded, but not necessarily how much capital it is prepared to lose once that threshold is crossed. Expected Shortfall can make that second question visible.
Diversification requires stress-based scrutiny. Portfolio construction based on historical correlations can give committees an incomplete view of protection during systemic events. Governance should therefore consider how the portfolio behaves when correlations rise, and several asset classes experience losses simultaneously.
Liquidity belongs within risk governance. A drawdown becomes a different governance problem when some assets cannot be sold, and cash obligations remain. Price risk, correlation and access to capital therefore need to be considered together when assessing severe scenarios.
Steps to Take
- Require Expected Shortfall alongside VaR. Ask for the expected magnitude of losses beyond the stated VaR threshold. This gives the committee visibility into the severity of outcomes that the headline measure leaves open.
- Replay historical drawdowns. Apply previous crisis periods to current portfolio exposures. The objective is not to predict a repetition of the same crisis, but to test how current allocations respond when familiar diversification assumptions come under pressure.
- Run combined stress scenarios. Examine conditions in which several risks materialise together, such as macroeconomic stress, currency movements and restrictions on access to illiquid investments.
- Stress correlation assumptions. Test what happens when assets that normally behave differently begin moving together. This makes the portfolio’s dependence on diversification assumptions explicit.
- Bring stress results into committee decisions. Use these analyses when reviewing risk appetite, liquidity requirements and portfolio construction rather than treating them as supplementary technical material. Effective oversight depends on decision-makers receiving information that allows them to evaluate delegated management rather than simply observe its results (Armstrong et al., 2010). Studies on Financial Reporting …
Independent Reporting
Delegated investment management creates an inherent information asymmetry. Managers possess detailed knowledge of portfolio construction, modelling assumptions and investment decisions, while principals and trustees depend on reporting to evaluate those decisions. Research on transparency and governance consistently identifies reliable reporting as a mechanism for narrowing this information gap and supporting effective oversight. Studies on Financial Reporting …
In this context, the value of better reporting is primarily protective rather than a promise of additional investment return. It lies in identifying risks that aggregated metrics can conceal, testing the assumptions behind reported results and giving decision-makers a stronger basis for questioning delegated managers.
For families that delegate substantial investment authority, independent oversight is therefore an essential part of effective governance. Consolidated reporting across managers and institutions allows risk to be assessed in the context of the family’s wider wealth structure rather than mandate by mandate.
Learn how The Cecily Group’s independent reporting can support portfolio oversight and governance: Financial Reporting
Stay tuned as I continue unpacking our reporting methodology, and subscribe to our newsletter to follow the full Inside the Data series.
References
Armstrong, C.S., Guay, W.R. and Weber, J.P. (2010) ‘The role of information and financial reporting in corporate governance and debt contracting’, Journal of Accounting and Economics, 50(2–3), pp. 179–234.
Yamai, Y. and Yoshiba, T. (2005) ‘Value-at-risk versus expected shortfall: A practical perspective’, Journal of Banking & Finance, 29(4), pp. 997–1015.
Longin, F.M. (2000) ‘From value at risk to stress testing: The extreme value approach’, Journal of Banking & Finance, 24(7), pp. 1097–1130.
Longin, F. and Solnik, B. (2001) ‘Extreme correlation of international equity markets’, The Journal of Finance, 56(2), pp. 649–676.