

Two managers each delivered a 10% annual return. On a traditional performance report, they appear identical. Yet one manager may have protected capital during market declines, while the other may have amplified every market movement to achieve the same result. The difference is not visible in the return figure itself, but it can materially affect the resilience of family wealth.
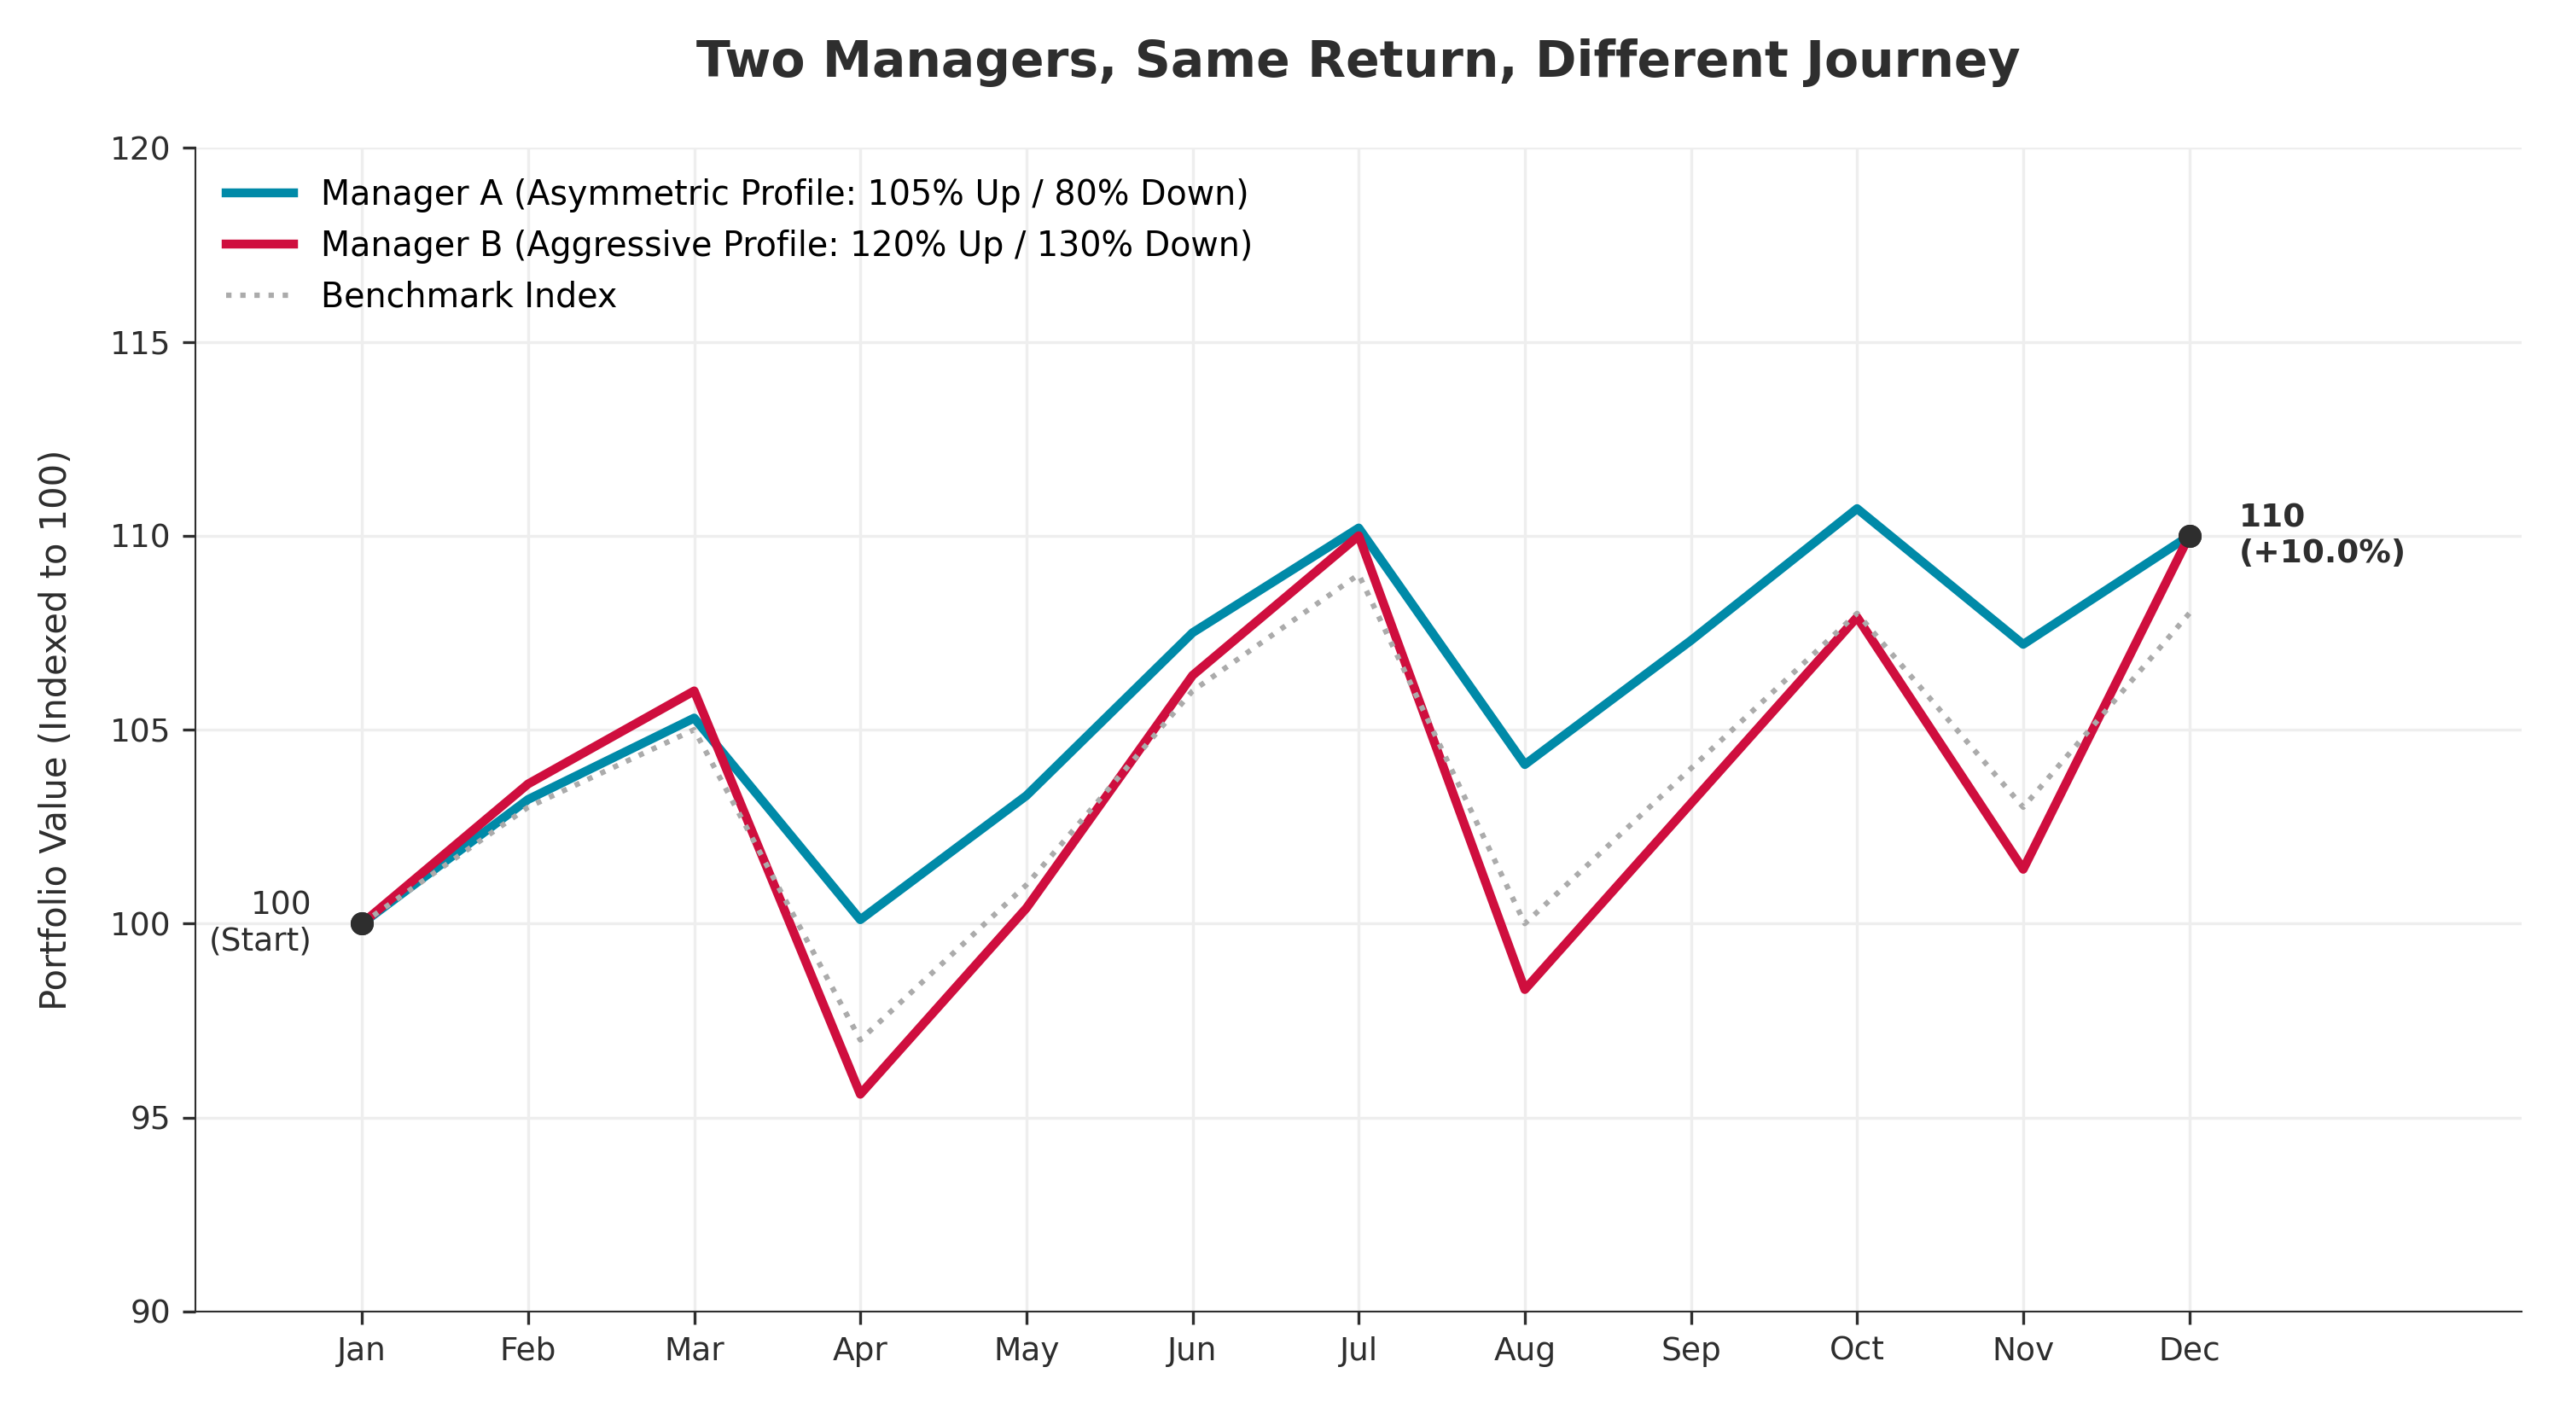
The issue is that most oversight processes begin and end with total return, even though total return says nothing about how that performance was achieved. It measures the outcome, not the behaviour that produced it.
The most commonly relied-upon performance measure is annualised total return. It is easy to communicate, comparable, but it is incomplete. It obscures how a manager behaved during periods of market stress and whether returns were generated through genuine investment skill or simply by assuming greater market risk.
This distinction becomes visible through capture ratios. An upside capture ratio measures how a manager performs during rising markets relative to a benchmark. A downside capture ratio measures how much of a market decline the manager participates in during falling markets. Together, they reveal the manager’s behavioural profile across different market environments.
A manager with a 120% upside capture ratio may appear highly skilled. However, if that same manager also exhibits a 130% downside capture ratio, the apparent outperformance may simply reflect higher market exposure rather than superior security selection. Families may believe they have hired an alpha-generating manager when, in fact, they have hired a manager with amplified market exposure.
For family offices, this distinction is important because wealth preservation depends as much on limiting losses as participating in gains. A portfolio that declines less during market stress requires far less recovery to return to its starting value. A 50% loss requires a subsequent 100% gain simply to break even.
Most reports are produced by the same institutions responsible for managing assets, often focusing solely on performance outcomes. Independent reporting adds another layer of oversight by analysing how returns were generated across different market conditions. This helps families distinguish genuine manager skill from risk-taking that only appears successful during favourable markets.
Why Strong Performance Does Not Automatically Indicate Skill
Managers rarely defend excessive downside participation directly. Instead, the argument is usually framed around long-term performance, growth capture, or market opportunity.
“We are long-term investors.”
The manager argues that short-term market declines are largely irrelevant because long-term returns remain positive.
This assumes downside participation is merely a temporary discomfort. In reality, losses have an asymmetric impact on wealth creation. A portfolio that falls 50% requires a subsequent 100% gain simply to recover. High downside capture, therefore, creates a compounding hurdle that can materially reduce long-term wealth accumulation (Tversky and Kahneman, 1991).
“Our high upside capture demonstrates investment skill.”
The manager argues that outperforming during rising markets is evidence of superior security selection.
This may be true, but not necessarily. A manager with 120% upside capture and 130% downside capture has not demonstrated asymmetric skill. They may simply be running a higher-beta portfolio, meaning a portfolio that is more sensitive to market movements than the benchmark. Research on volatility and expected returns suggests that performance can often be explained by risk exposure rather than stock-selection ability alone (Ang et al., 2006).
“The benchmark is not the objective.”
The manager argues that capture ratios place too much emphasis on benchmark-relative behaviour.
Benchmarks are imperfect, but capture ratios are not designed to reward benchmark-hugging. Their purpose is to reveal behaviour across different market environments. A manager whose downside capture consistently exceeds 100% is participating in market declines more heavily than the benchmark itself, regardless of whether the benchmark is the primary objective.
These arguments share a common assumption: that performance outcomes alone are sufficient evidence of manager quality.
If total return cannot distinguish between skill and amplified market exposure, how does hidden risk become embedded in manager performance profiles without appearing in traditional oversight reports?
When Risk-Taking Masquerades as Skill
Traditional reporting focuses on outcomes rather than behaviour. As a result, managers can gradually increase market exposure without changing how success is perceived.
The mechanism typically develops in four stages.
1. The manager increases market sensitivity
Managers face constant pressure to outperform benchmarks and peers.
One way to improve relative performance is through superior security selection. Another is by increasing exposure to higher-beta securities, meaning assets that tend to rise more than the market during favourable conditions. Technology stocks, small-cap equities, and highly leveraged companies often fall into this category. This behaviour becomes evident when the internal scaffolding of a portfolio starts to change by moving from value to growth stocks when the mandate has not changed, etc.
During bull markets, this approach can produce attractive results. Upside capture ratios rise, performance rankings improve, and clients become more satisfied.
2. Strong returns reinforce the narrative of skill
As performance improves, attention naturally shifts toward outcomes.
Committees discuss:
- annual returns,
- benchmark outperformance,
- and ranking tables.
Less attention is paid to how those results were achieved.
This creates a reporting blind spot. A manager with a 120% upside capture ratio may be praised for strong performance even though the underlying driver is increased market exposure rather than superior investment decisions.
3. The downside remains hidden during favourable markets
The weakness of the strategy only becomes visible when markets reverse.
Because rising markets reward risk-taking, high-beta portfolios often appear more skilful than they actually are. The downside capture profile remains largely theoretical until market conditions deteriorate.
This is why governance frameworks that focus primarily on total return often struggle to distinguish between genuine alpha generation and simple market amplification.
4. Market stress exposes the true behaviour profile
When markets decline, the behavioural profile becomes visible.
Managers who generated returns primarily through higher beta frequently experience significantly larger drawdowns than expected. The apparent skill demonstrated during rising markets disappears because the same risk exposure that amplified gains now amplifies losses.
Example: During the 2022 market correction, many Growth-oriented funds that had outperformed during the 2020–2021 rally became some of the worst-performing categories as rising interest rates pressured high-duration growth assets. Investors who believed they owned differentiated alpha often discovered that a significant portion of prior outperformance had been driven by exposure to the prevailing market regime (Kolostyak, 2023).
The Compounding Cost of Excessive Downside Capture
The long-term impact extends beyond a single market correction.
A manager with:
- 120% upside capture,
- and 130% downside capture,
may still produce attractive returns during prolonged bull markets.
However, losses compound differently than gains.
A portfolio that captures significantly more downside than the market requires progressively larger gains to recover. This creates what behavioural finance research describes as the asymmetric impact of losses, where downside participation can have a disproportionately large influence on long-term wealth accumulation (Tversky and Kahneman, 1991).
At this point, the issue develops into a governance problem concerning resilience and capital preservation.
How to See the Behaviour Hidden Behind Performance
Total return reveals the outcome. Capture ratios reveal the behaviour that produced it. Effective oversight requires moving beyond performance measurement and analysing how managers participate in both rising and falling markets.
1. Up-Capture vs Down-Capture Matrix
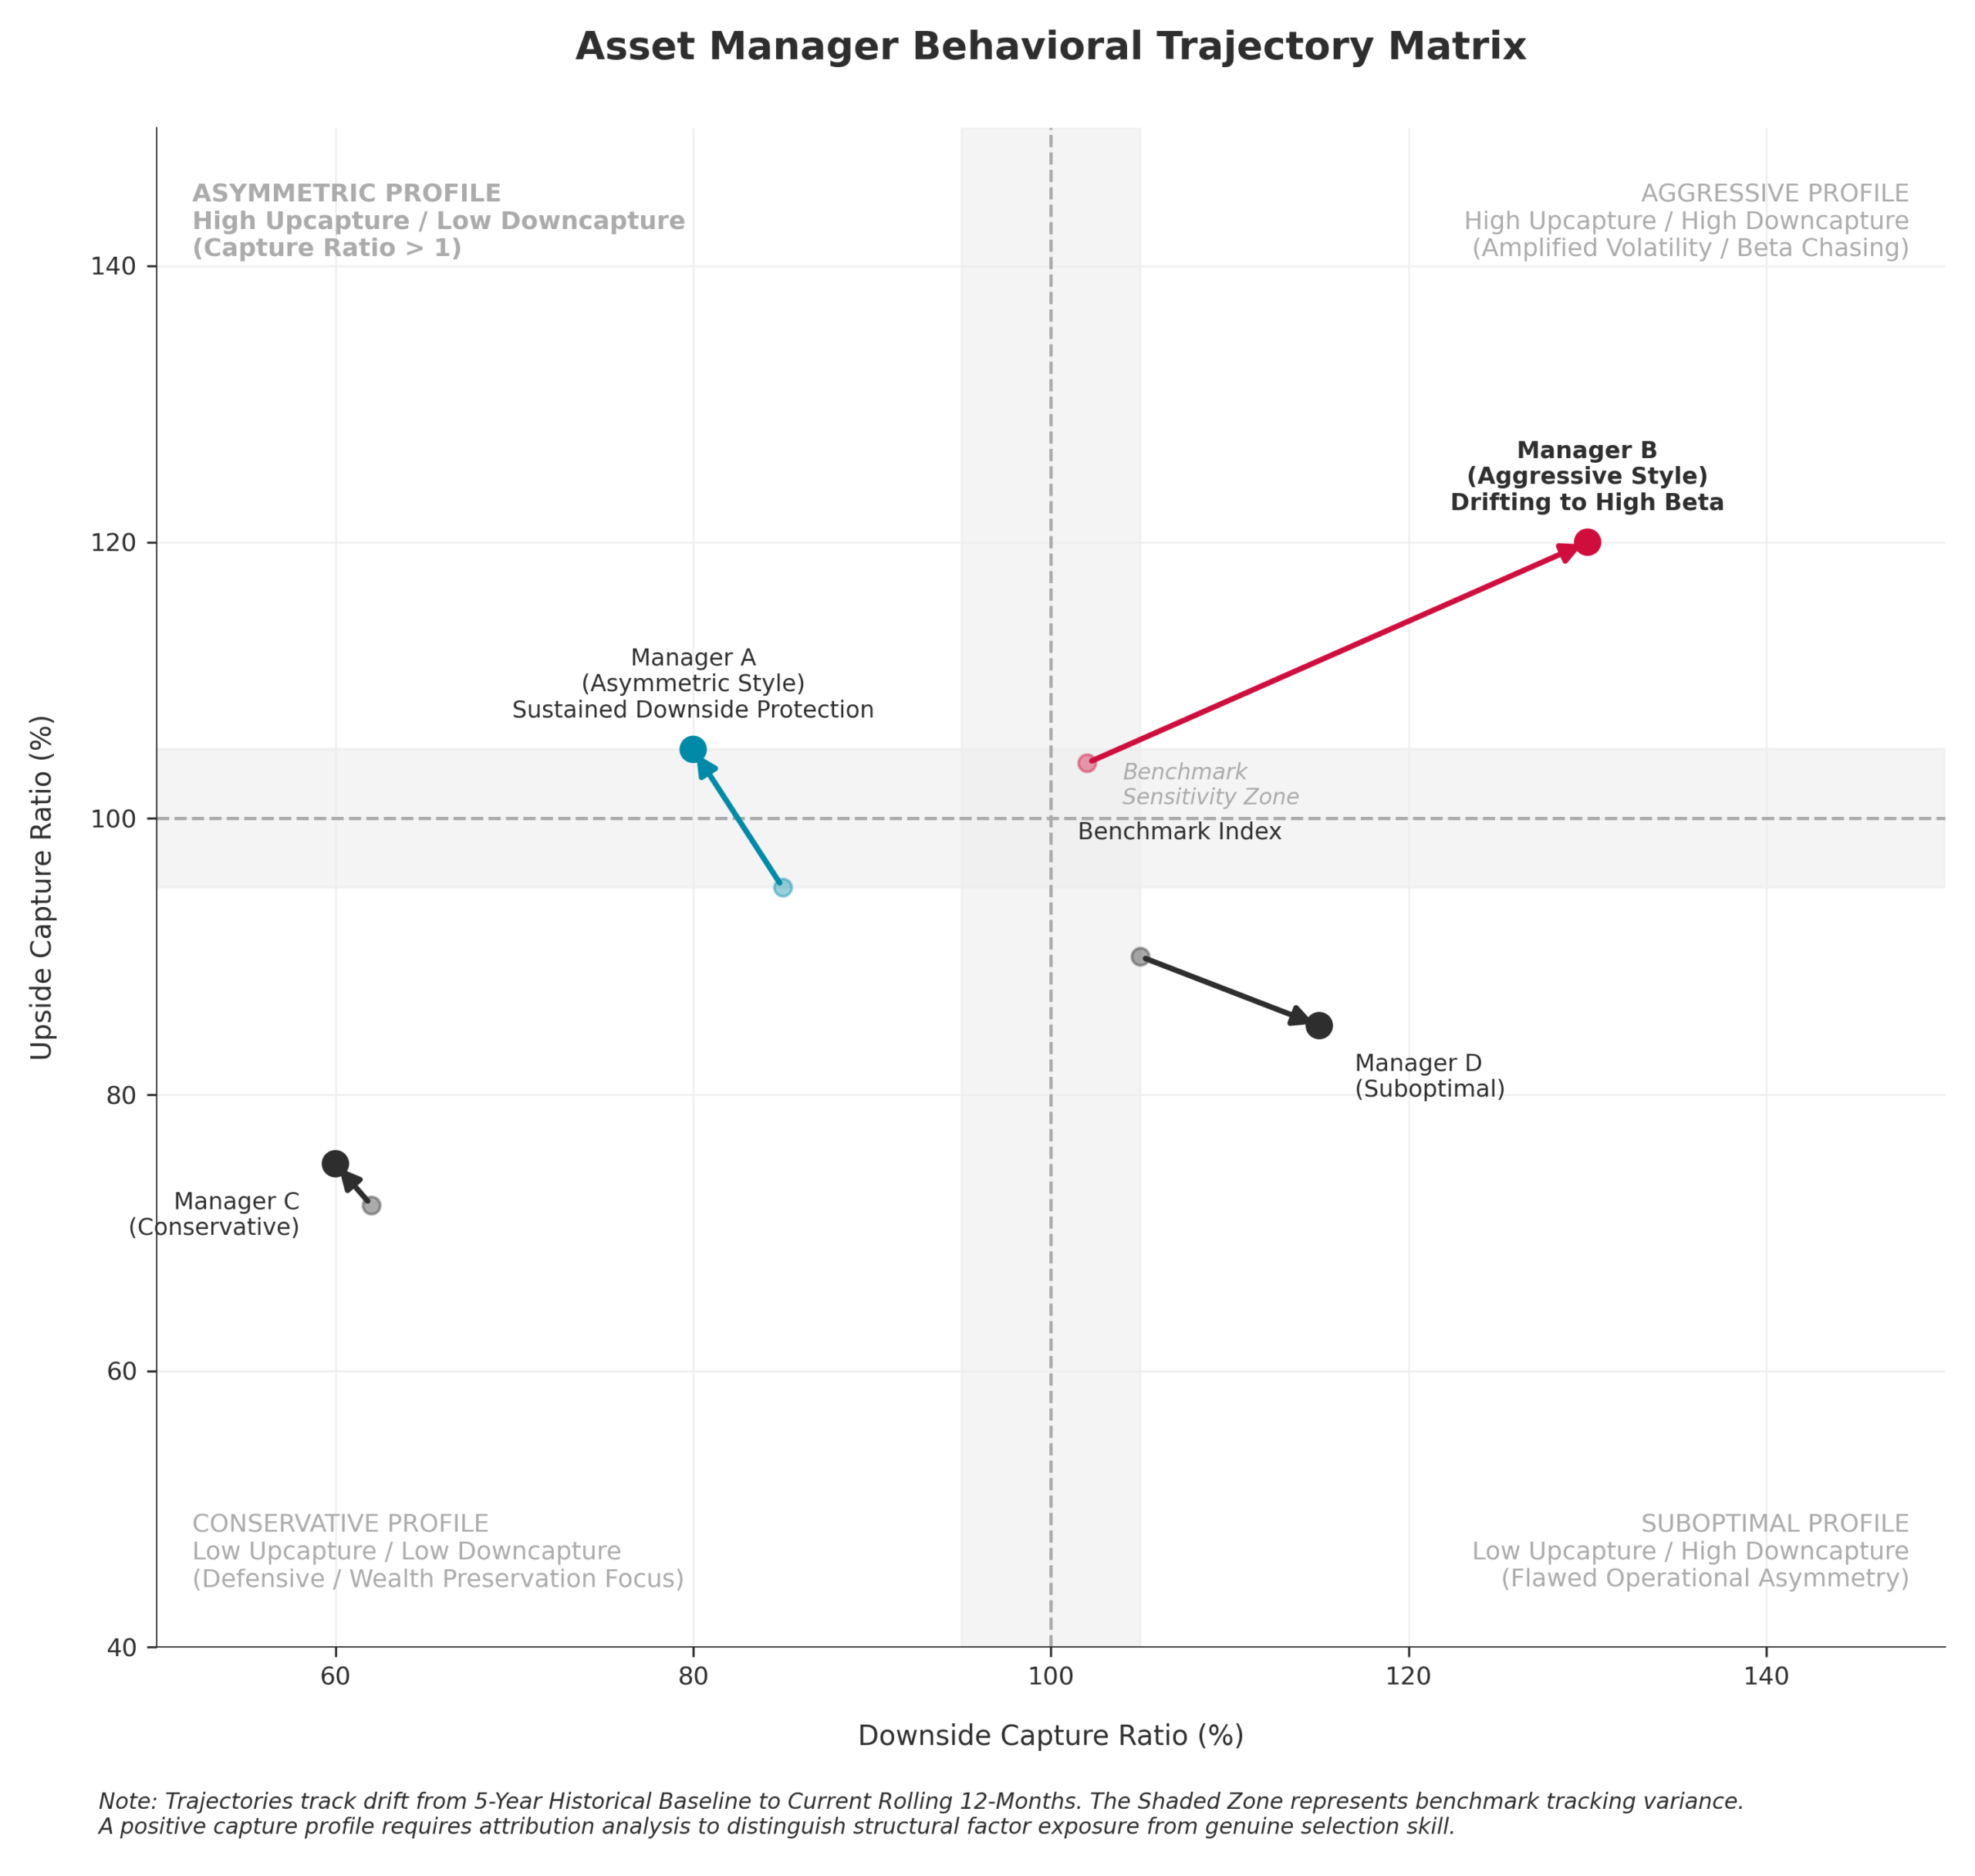
What it does:
Plots managers on a two-dimensional matrix using upside capture and downside capture ratios.
Required inputs:
Manager returns, benchmark returns, and capture ratio calculations over a consistent time period.
What it reveals:
Whether managers generate returns through asymmetric behaviour or simply by increasing market exposure.
Why it matters:
Two managers with identical returns may occupy completely different positions on the matrix. One may be preserving capital during downturns while the other amplifies market movements in both directions.
Subtleties & Limitations:
- Results can vary depending on the benchmark selected
- Short measurement periods may distort behaviour patterns
- Extreme market events can temporarily influence ratios
- Does not isolate security-selection skill directly
2. Capture Spread Analysis
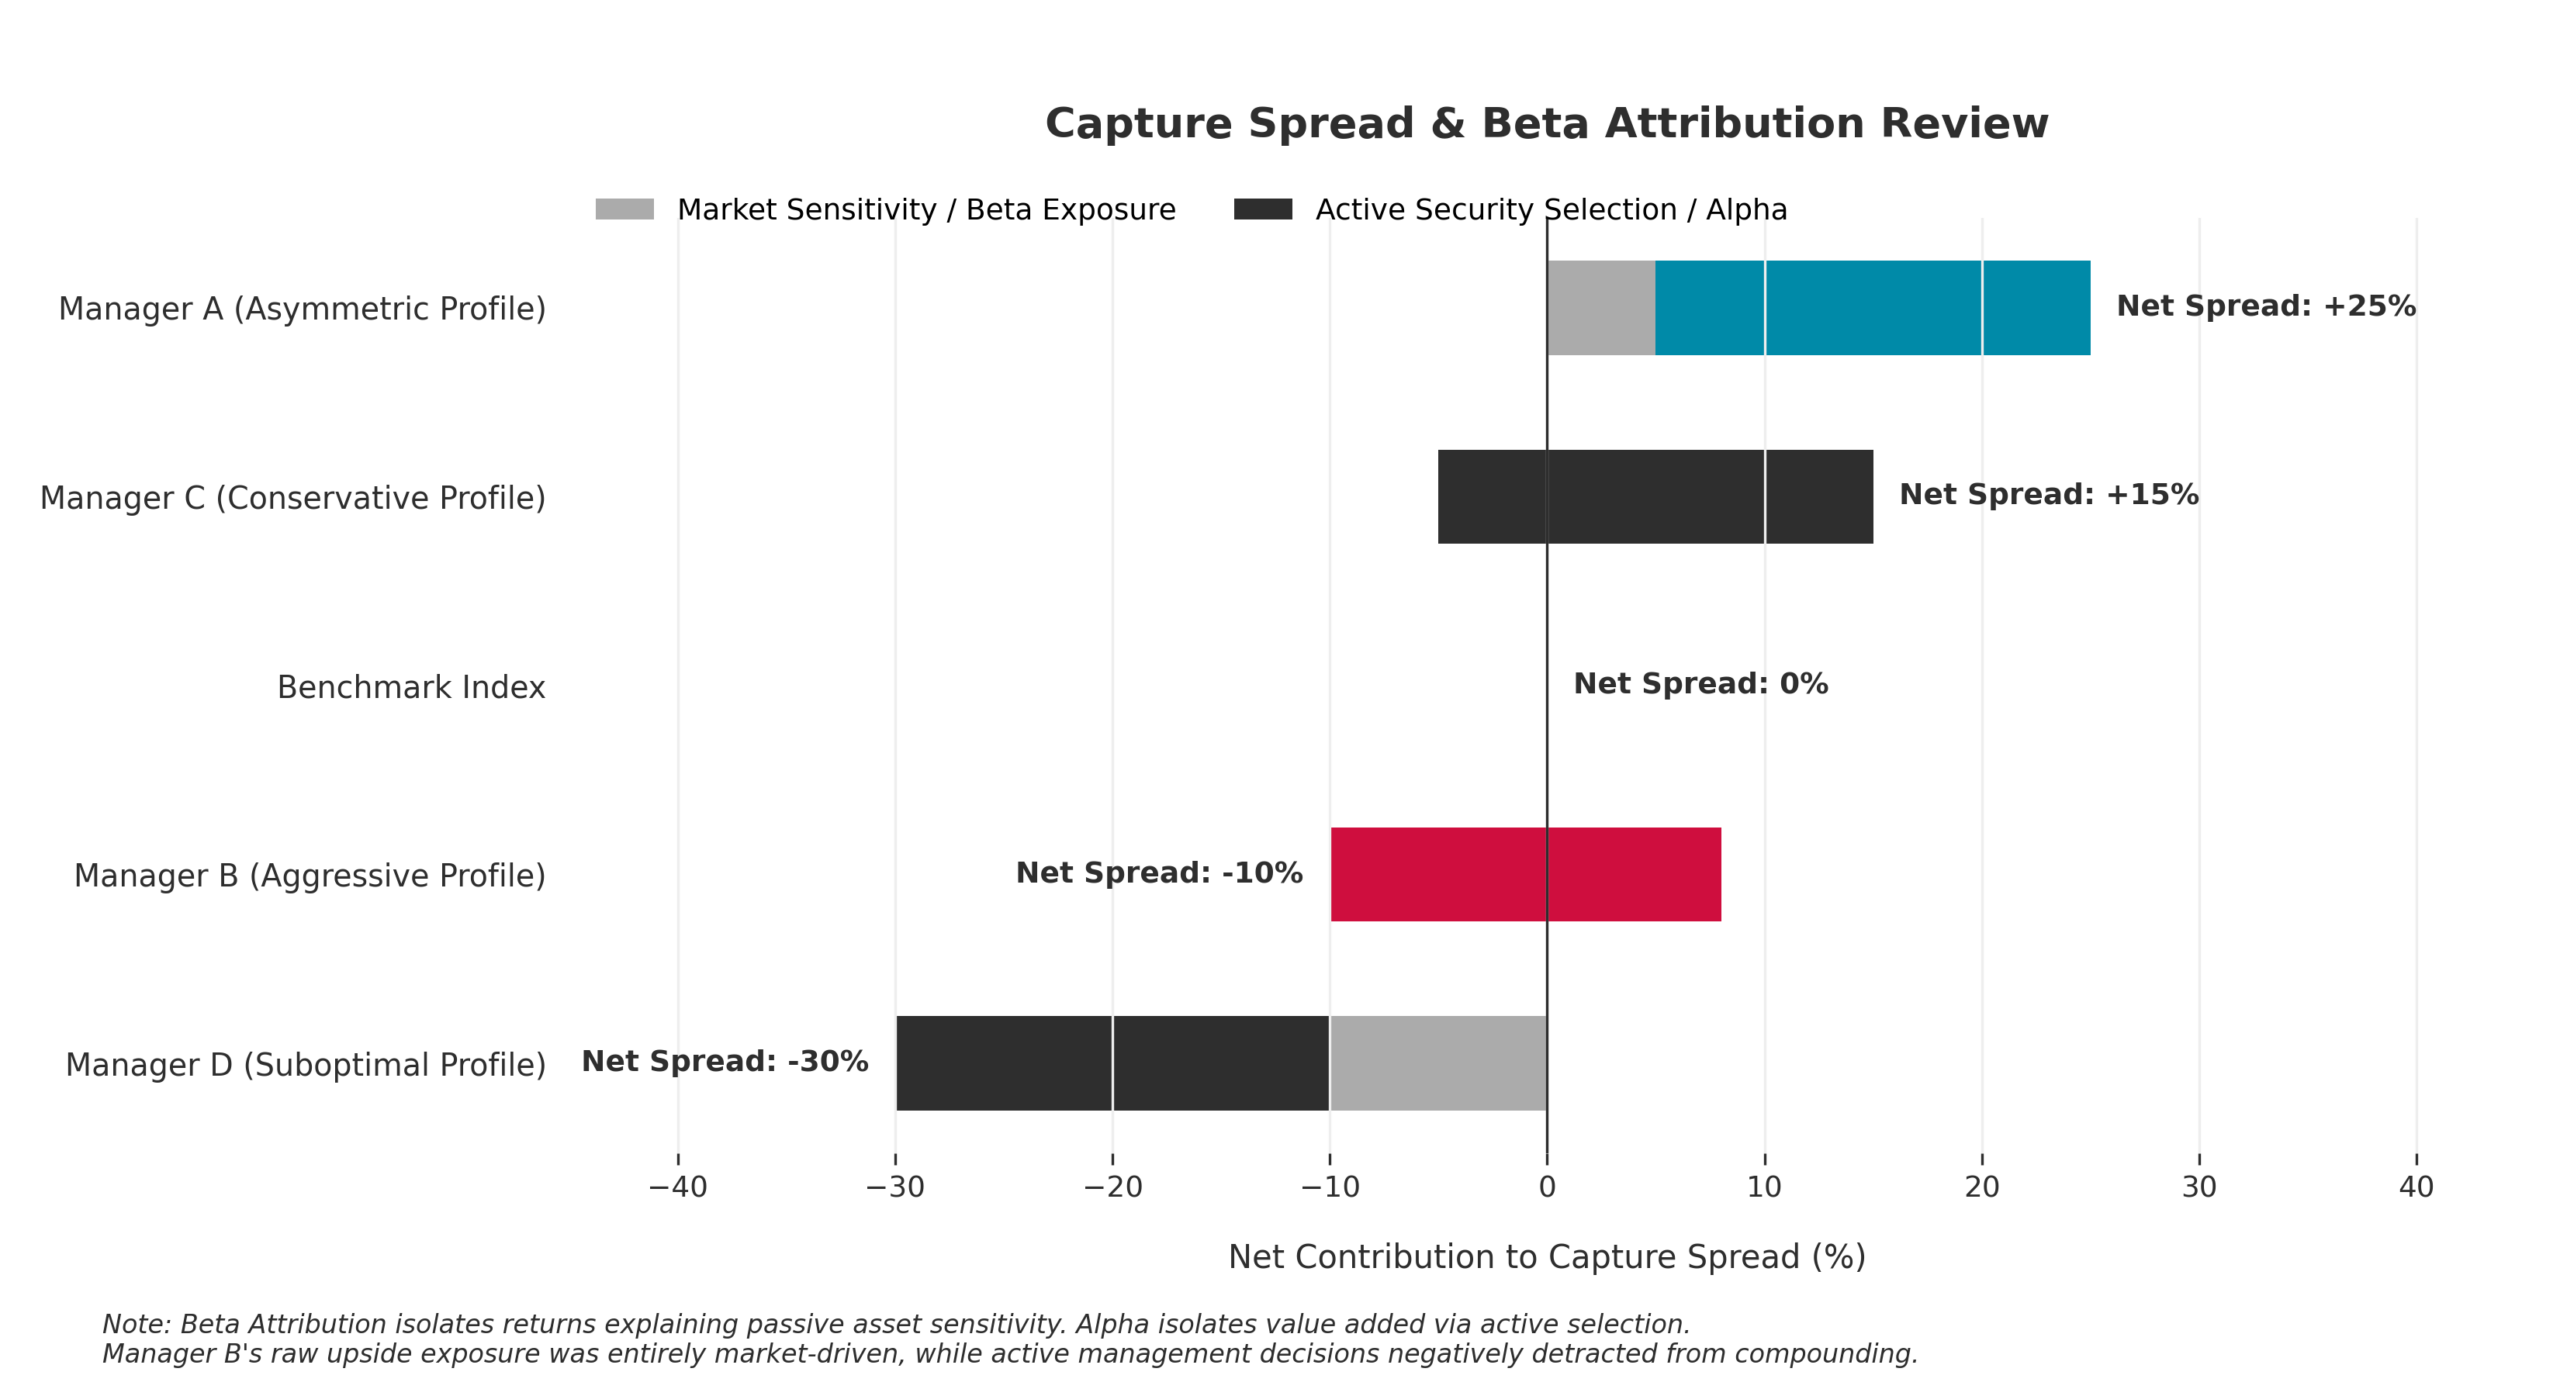
What it does:
Calculates the difference between upside capture and downside capture.
Required inputs:
Upside capture ratio and downside capture ratio for each manager.
What it reveals:
Whether a manager captures more upside than downside over time.
Why it matters:
A positive capture spread suggests the manager participates more in market gains than in market declines. It suggests the manager participates more effectively in rising markets than falling ones.
Subtleties & Limitations:
- A positive spread does not automatically prove alpha generation
- Extremely low downside participation may result from defensive positioning rather than skill
- Should be evaluated across multiple market cycles
3. Rolling Capture Ratio Analysis
What it does:
Measures capture ratios across rolling periods rather than a single observation window.
Required inputs:
Historical manager and benchmark returns over several years.
What it reveals:
Changes in manager behaviour through time.
Why it matters:
A manager hired for downside protection may gradually increase market sensitivity without triggering concern through traditional performance reports.
Subtleties & Limitations:
- Requires sufficient historical data
- Market regimes influence results
- Behavioural changes may emerge slowly and require long observation periods
4. Beta Attribution Review
What it does:
Separates performance attributable to market exposure from performance attributable to manager decisions.
Required inputs:
Portfolio returns, benchmark returns, factor exposures, and beta estimates.
What it reveals:
Whether performance is driven primarily by skill or by increased market sensitivity.
Why it matters:
It helps determine whether active fees are being paid for genuine alpha or simply for amplified benchmark exposure.
Subtleties & Limitations:
- Results depend on the quality of factor models used
- Different models may attribute performance differently
- Does not fully explain behavioural decision-making
From Performance Measurement to Behavioural Oversight
Strong performance can create a false sense of security.
Return alone does not reveal resilience
Managers with similar returns may expose family capital to dramatically different levels of downside risk. Governance that focuses only on outcomes risks rewarding behaviour that becomes destructive during market stress.
Risk-taking can be mistaken for skill
When rising markets dominate the reporting period, managers who simply increase market exposure may appear highly talented. Without behavioural analysis, committees may struggle to distinguish genuine alpha generation from amplified beta.
Manager selection becomes portfolio construction
Capture ratios can reveal how managers interact with one another inside the broader family portfolio. Combining several managers with similar downside behaviour can unintentionally concentrate risk.
Steps to Take
1. Plot the Capture Matrix
Review all equity managers on an upside-capture versus downside-capture chart. This creates an immediate visual representation of behavioural differences.
2. Identify Hidden Beta
Review managers exhibiting both high upside and high downside capture. Determine whether their performance reflects skill or elevated market exposure.
3. Define a Defensive Anchor
Maintain at least one manager whose primary role is downside protection rather than maximum upside participation.
4. Monitor Behavioural Drift
Compare current capture ratios with three-year and five-year averages. Significant changes may indicate evolving risk-taking behaviour.
5. Establish Escalation Thresholds
Create governance triggers for managers whose downside capture exceeds agreed limits for a sustained period.
Independent Reporting
Independent reporting helps reveal the mechanism behind returns by distinguishing genuine skill from amplified market exposure.
See how independent reporting can strengthen your oversight: https://thececilygroup.com/financial-reporting/
Stay tuned as we continue unpacking our reporting methodology, and subscribe to our newsletter to follow the full Inside the Data series.
References
Ang, A., Hodrick, R.J., Xing, Y. and Zhang, X. (2006) ‘The cross-section of volatility and expected returns’, The Journal of Finance, 61(1), pp. 259–299. Available at: https://doi.org/10.1111/j.1540-6261.2006.00836.x
Kolostyak, S. (2023) ‘2022’s best and worst performing funds’, Morningstar, 5 January. Available at: https://global.morningstar.com/en-gb/funds/2022-s-best-and-worst-performing-funds
Tversky, A. and Kahneman, D. (1991) ‘Loss aversion in riskless choice: A reference-dependent model’, Quarterly Journal of Economics, 106(4), pp. 1039–1061. Available at: https://doi.org/10.2307/2937956
Visual: Liubov Popova – Textile design