

A stock with a beta of 0.69 was trading 34.26% below its 12-month peak. Another, with a beta of 0.77, was down 32.41%. A third, with a beta of 0.79, had fallen 18.22%. In one consolidated report, the Beta vs. Distance-from-Peak Matrix placed all three in a part of the portfolio that conventional risk measures could still describe as relatively defensive.
Beta measures how sensitive an investment has historically been to movements in the broader market. A beta below 1.0 indicates lower historical sensitivity to the selected market benchmark, but it does not measure company-specific risk or guarantee capital protection (Sharpe, 1964).
This creates a blind spot at both security and portfolio level. A portfolio beta of 0.75 may suggest relatively low systematic market risk, while individual holdings within it can still experience substantial declines. If oversight stops at aggregate beta or headline performance, those losses can remain disconnected from the defensive role the holdings were expected to perform.
For trustees and family investment committees, the relevant question is therefore not simply whether portfolio beta remains within an acceptable range. It is whether the individual investments expected to provide defensive characteristics are actually preserving capital.
The Cecily Group’s independent reporting consolidates portfolios across banks and asset managers and analyses the underlying positions at transaction level. This allows aggregate measures to be tested against what is happening within individual holdings, rather than accepted as sufficient evidence of portfolio risk.
When the Investment Rationale Stops Holding
A substantial drawdown in a low-beta holding does not automatically mean the investment thesis has failed. Managers may have legitimate reasons for maintaining the position. The governance problem arises when those explanations substitute for evidence that the holding still serves its intended role.
“This is a temporary valuation derating”
A manager may argue that high-quality defensive companies have fallen out of favour as capital moves towards higher-growth or momentum-driven stocks. Market rotations can produce periods of significant underperformance, but low beta only describes historical sensitivity to broad market movements. It provides no direct measure of company-specific risk (Sharpe, 1964), including risks arising from factors such as slowing growth, earnings pressure or valuation compression.
“The dividends compensate for the drawdown”
Income can offset part of a decline in market value over time. Yet a dividend yield of a few percentage points provides limited protection when a holding has lost 20–30% of its value. The relevant question is whether total return, including distributions, supports the manager’s claim that the position continues to preserve capital.
“These are long-term strategic holdings”
A long investment horizon can justify tolerating short-term volatility where the underlying thesis remains intact. It can also make persistent deterioration easier to rationalise. Research on the disposition effect suggests that investors may be reluctant to realise losses, leading them to hold underperforming positions longer than they otherwise would (Shefrin and Statman, 1985).
For a family investment committee, these explanations therefore need to be tested against the data rather than accepted as narratives. At what point does a defensive holding experiencing a substantial drawdown cease to function as a defensive holding?
How Defensive Holdings Become a Hidden Risk
A low-beta allocation often begins with a reasonable objective: reduce the equity portfolio’s sensitivity to broad market movements while retaining participation in long-term growth.
The problem appears when low market sensitivity becomes shorthand for defensiveness. Beta measures systematic risk — the extent to which a holding tends to move with the market (Sharpe, 1964). Company-specific deterioration can therefore develop without being captured directly by beta.
When those risks materialise, a low-beta stock can experience a substantial drawdown even while the wider market remains relatively stable. Yet the portfolio’s aggregate beta may continue to look defensive. At committee level, the headline risk measure can therefore remain reassuring while individual positions are losing significant value.
The effect can persist when the original rationale for holding the investment remains unchanged. A position may continue to be described as a high-quality, long-term or defensive holding even after its observed behaviour has diverged from that description. Without examining beta alongside distance from peak, the divergence can remain difficult to see in standard portfolio reporting.
This is defensive mandate erosion: capital remains allocated to an investment on the basis of its defensive role even as its observed performance raises questions about whether it still fulfils that role.
Consequences become visible when drawdowns deepen, persist across reporting periods, or affect several supposedly defensive positions simultaneously. At that point, the governance question moves beyond whether the holdings will eventually recover. The investment committee needs to determine whether the risks being taken remain consistent with the purpose of the allocation.
Nestlé illustrates why a defensive classification should not be treated as permanent. The company has traditionally exhibited characteristics associated with defensive equities, including relatively stable consumer demand. Yet during 2023 and 2024, several underlying business indicators highlighted growing pressure. In 2023, organic growth of 7.2% was driven by 7.5% pricing, while real internal growth declined by 0.3%. By mid-2024, Nestlé had lowered its sales growth outlook amid increasing consumer price sensitivity, and full-year organic growth subsequently slowed to 2.2% (Reuters, 2024; Nestlé, 2025).
This shows that risks affecting an individual holding can change independently of the market sensitivity captured by beta. For an investment committee, historical beta therefore needs to be considered alongside evidence of what is happening to the investment itself.
Seeing Beyond Portfolio Beta
Portfolio-level beta can indicate how sensitive an equity allocation has historically been to broad market movements. To understand whether supposedly defensive holdings are fulfilling their intended role, however, oversight needs to move down to the individual security level.
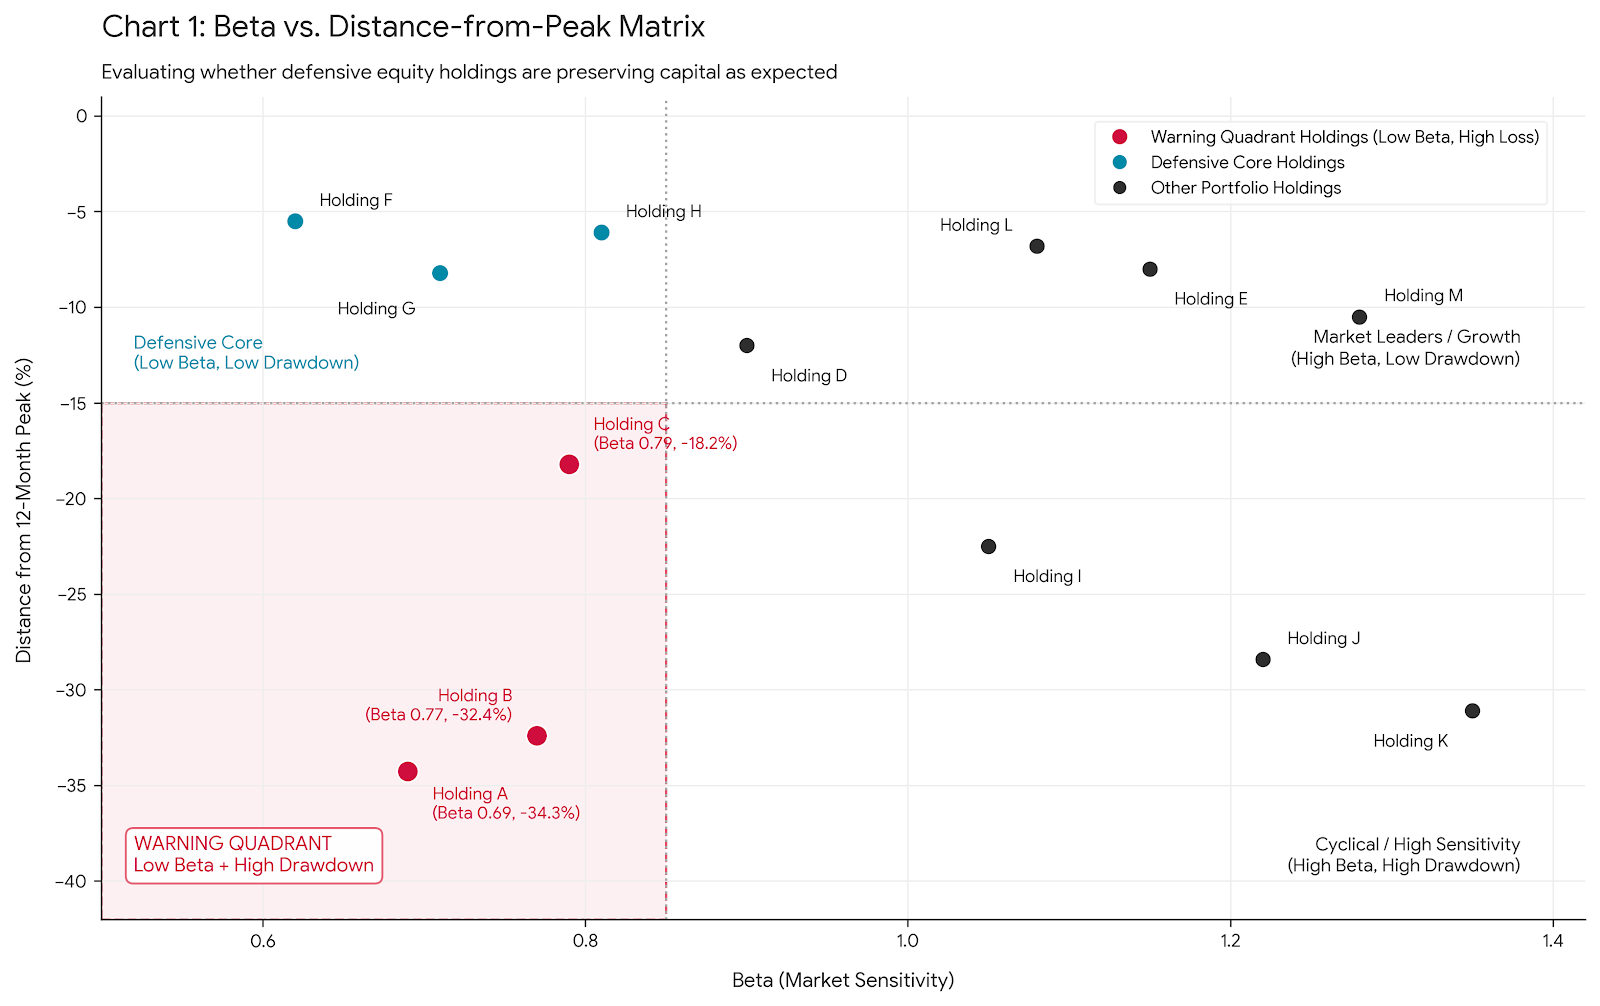
The Beta vs. Distance-from-Peak Matrix brings these two dimensions together. Each equity holding is plotted according to its beta and its distance from its trailing 12-month peak, making it possible to identify positions where relatively low market sensitivity coexists with substantial capital loss.
What it does
Plots individual equity holdings according to beta on one axis and percentage decline from their trailing 12-month peak on the other.
Required inputs
Individual security holdings, historical security prices, an appropriate market benchmark and sufficient return history to calculate beta.
What it reveals
The matrix distinguishes between holdings experiencing substantial losses alongside high market sensitivity and those experiencing substantial losses despite relatively low beta. The latter fall into the report’s Warning Quadrant: Low Beta + High Drawdown.
Why it matters
A low portfolio beta can remain within an acceptable range while individual positions experience significant losses. Looking at beta and drawdown together allows an investment committee to identify holdings whose observed capital-preservation characteristics may no longer correspond with the role assigned to them.
Subtleties & Limitations
Beta is backwards-looking. Historical sensitivity to a benchmark may not describe how a security will behave as market conditions or company fundamentals change.
Benchmark selection matters. Beta depends on the benchmark against which it is calculated. An inappropriate benchmark can make the resulting risk measure less informative.
Distance from peak is path-dependent. A large drawdown identifies capital loss from a previous high but does not establish why the decline occurred or whether the investment thesis remains valid.
Dividends are not captured by price drawdown alone. A distance-from-peak measure based on market price can overstate the economic loss where meaningful distributions have been received. Total return should therefore be considered when interpreting the result.
The matrix identifies exceptions, not causes. A position in the Warning Quadrant is a signal for scrutiny. It does not establish that the manager should sell the holding or that the original investment decision was incorrect.
Used this way, the matrix changes the oversight question. Instead of asking only, “Is our equity portfolio defensive?”, the committee can ask, “Which holdings are producing outcomes inconsistent with the defensive characteristics we expected, and why?”
From Warning Signal to Governance Action
The warning signal only becomes valuable when it changes the questions being asked. Once a defensive holding shows substantial drawdown despite relatively low beta, the focus should move beyond classification to whether the original investment thesis still holds, what is driving the loss, and what level of oversight is required.
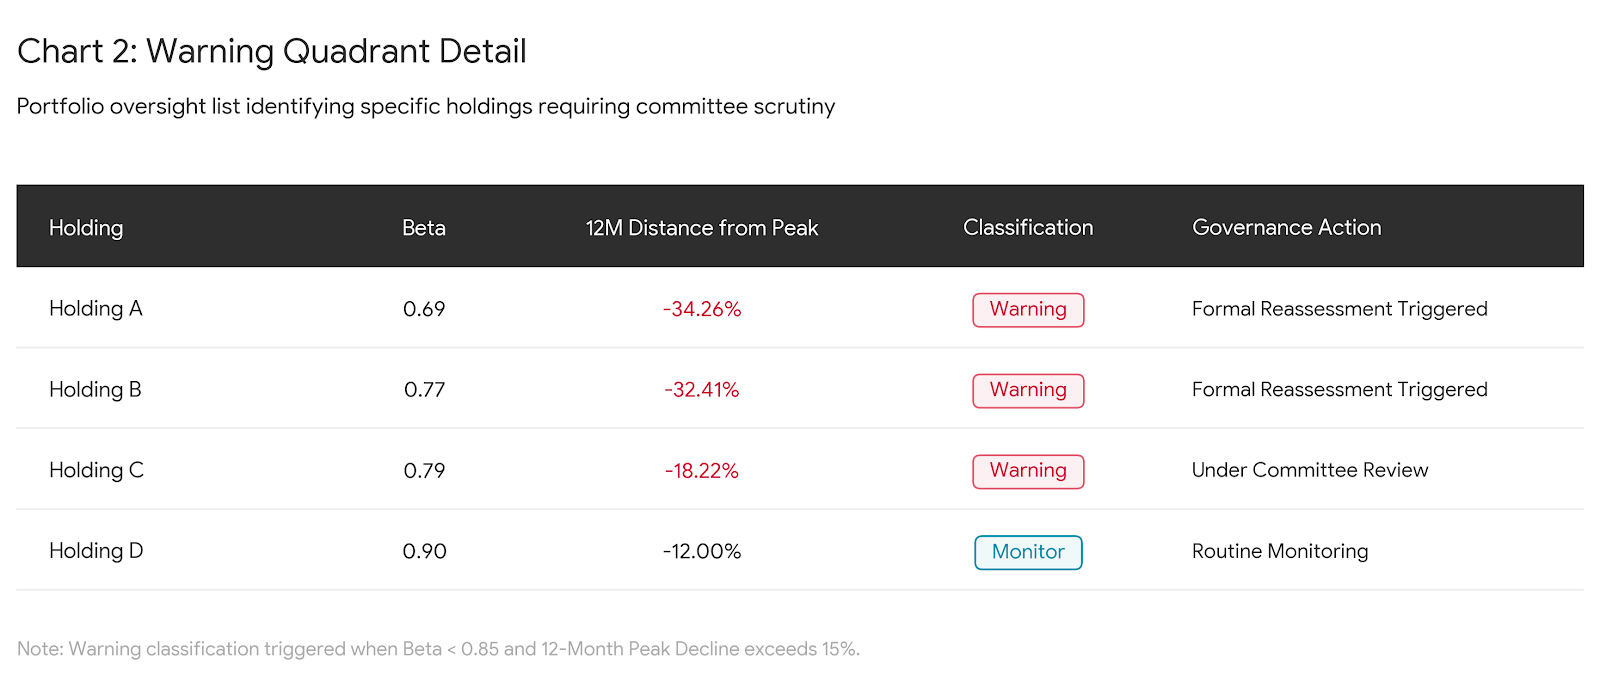
Risk labels require scrutiny. A defensive classification should not become a permanent assumption. When individual holdings experience substantial drawdowns despite relatively low beta, the investment committee needs to examine whether the original rationale for their role in the portfolio still holds.
Manager explanations require evidence. Terms such as “quality”, “long-term holding” and “temporary derating” may describe a legitimate investment thesis, but they do not resolve the governance question. Independent reporting gives trustees and principals information with which to test these explanations and hold managers accountable. Reliable financial information is particularly important for effective oversight where decision-makers depend on others to manage assets on their behalf (Armstrong et al., 2016).
Aggregate risk can conceal individual failures. A portfolio can remain within its overall risk parameters while individual holdings behave in ways that warrant attention. Oversight therefore needs to consider both portfolio-level measures and the positions driving them.
Steps to Take
- Review the Warning Quadrant. Require regular identification of low-beta holdings experiencing material drawdowns and ask managers to explain the investment rationale for each position.
- Define review triggers. Establish thresholds at which a defensive holding requires formal reassessment. A trigger should initiate scrutiny rather than an automatic sale.
- Test the original investment thesis. Ask what justified the holding’s defensive role when it was acquired and whether the assumptions supporting that decision remain valid.
- Separate market risk from company-specific risk. When a low-beta holding experiences a significant drawdown, require an explanation of whether the loss reflects broader market conditions, sector pressures or developments specific to the company.
- Track flagged positions over time. Review whether holdings remain in the Warning Quadrant across successive reporting periods. Persistent exceptions deserve a different level of governance attention from short-lived price movements.
Independent Financial Reporting
Asset managers inevitably know more about their investment decisions than the principals, trustees and family members overseeing them. This information asymmetry limits effective governance when oversight relies primarily on reporting produced by the managers themselves. Research on corporate governance similarly finds that information problems can constrain the ability of outside decision-makers to monitor those acting on their behalf (Armstrong et al., 2016).
Independent analysis reduces that information gap. Its value lies in exposing risks, inconsistencies and questions that may otherwise remain hidden until their financial consequences become harder to address. Independent oversight should therefore be treated as a minimum fiduciary standard wherever substantial family wealth is delegated to external managers.
Discover how The Cecily Group’s independent reporting can strengthen portfolio oversight and manager accountability: https://thececilygroup.com/financial-reporting/
Stay tuned as I continue unpacking our reporting methodology, and subscribe to our newsletter to follow the full Inside the Data series.
References
Armstrong, C.S., Guay, W.R., Mehran, H. and Weber, J.P. (2016) ‘The role of financial reporting and transparency in corporate governance’, Economic Policy Review, 22(1), Federal Reserve Bank of New York. Available at: https://www.newyorkfed.org/medialibrary/media/research/epr/2016/epr_2016_post-crisis-proposal_armstrong.pdf
Nestlé (2025) ‘Full-year results 2024’, 13 February 2025. Available at: https://www.nestle.com/media/pressreleases/allpressreleases/full-year-results-2024
Rybska, A. and Shabong, Y. (2024) ‘Nestle, Unilever sales disappoint as consumers hunt for value’, Reuters, 25 July 2024. Available at: https://www.reuters.com/business/retail-consumer/nestle-misses-first-half-organic-sales-estimates-lowers-full-year-guidance-2024-07-25/
Sharpe, W.F. (1964) ‘Capital asset prices: A theory of market equilibrium under conditions of risk’, The Journal of Finance, 19(3). Available at: https://doi.org/10.1111/j.1540-6261.1964.tb02865.x
Shefrin, H. and Statman, M. (1985) ‘The disposition to sell winners too early and ride losers too long: Theory and evidence’, The Journal of Finance. Available at: https://doi.org/10.1111/j.1540-6261.1985.tb05002.x