

40% Active Share. A manager presented as active may hold a portfolio that differs from its benchmark by less than half, while still charging an active management fee. The family is paying for investment judgment, but much of the return may come from market exposure that could have been accessed through a low-cost passive instrument.
Standard manager reporting rarely makes this visible. It typically reports net return, benchmark-relative performance, and broad allocation. These figures may show whether the portfolio performed, but not whether the family paid the right price for the source of that performance.
The net portfolio return, the final number after fees and costs, feels complete. Still, it obscures whether the return came from genuine security selection, benchmark exposure, tactical trading, or fee drag.
However, active management only deserves premium pricing when it delivers differentiated decisions. Active Share measures the proportion of a portfolio that differs from its benchmark and is widely used to identify potential closet indexing, where portfolios remain close to the benchmark while charging active fees (Cremers and Petajisto, 2009; ESMA, 2025).
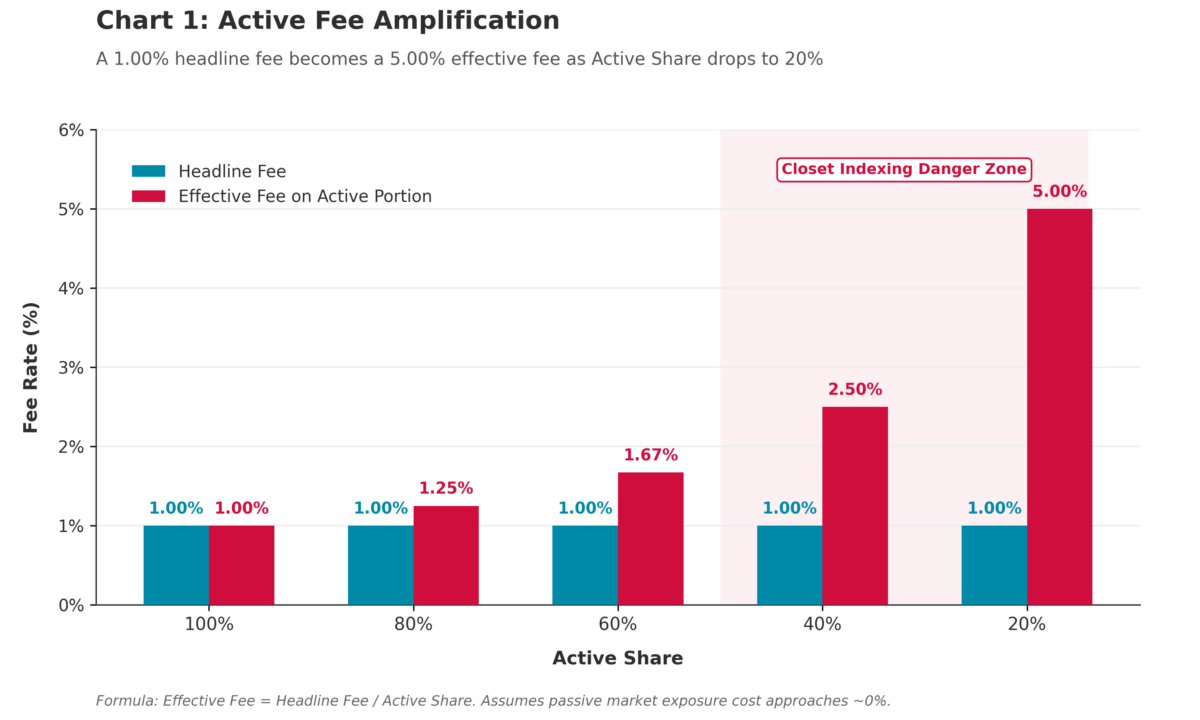
Active Fee Amplification
When Active Management Stops Making a Difference
The issue rarely appears because a manager is deliberately attempting to overcharge investors. More often, it emerges through a set of widely accepted industry narratives around risk management, tactical flexibility, and performance. Each contains an element of truth. The governance challenge lies in distinguishing explanations that justify a process from evidence that justifies the cost.
“We provide risk-managed exposure by staying close to the benchmark.”
The argument is that low tracking error and proximity to the benchmark reduce volatility and downside surprises.
The problem is that benchmark similarity does not automatically create value for the family. If most holdings overlap with the index, the family is primarily receiving market exposure while paying active fees. Research on Active Share found that portfolios with very low differentiation from their benchmarks have historically struggled to justify active-management fees through excess returns (Cremers and Petajisto, 2009).
A useful follow-up question is straightforward: if the portfolio closely resembles the benchmark, what specifically justifies the fee premium over a passive alternative?
“Our high turnover demonstrates tactical agility.”
The argument is that frequent trading allows the manager to respond quickly to changing market conditions and capture opportunities.
The difficulty is that every trade creates friction. Commissions, bid-ask spreads, market impact, taxes, and execution costs all reduce realised returns. A tactical decision must first overcome these costs before it contributes value to the portfolio. Barber and Odean (2000) found that investors who traded most frequently earned substantially lower net returns than those who traded less often.
High activity alone does not necessarily indicate skill. Research has found that benchmark-relative performance was more closely associated with stock selection than with volatility created through factor bets or tracking error (Anand et al., 2012).
The relevant question is not how often the manager trades, but whether the value generated exceeded the cost of implementation.
“The portfolio has produced acceptable returns.”
The argument is appealing because it focuses on outcomes rather than process.
Yet acceptable returns can conceal inefficient implementation. A portfolio returning 8% may appear successful until compared with a passive alternative that delivered a similar result at a fraction of the cost. In such cases, the family may be paying for activity rather than skill. As French (2008) showed, fees, expenses, and trading costs create a significant hurdle for active management, reducing the value delivered to investors as a group.
For fiduciaries, the question is whether the family received sufficient value for the fees and costs incurred to achieve them. The challenge, then, is understanding how portfolios that appear active, disciplined, and successful can gradually become expensive forms of passive exposure without triggering concern from trustees, family councils, or advisors.
When Active Management Stops Being Active
The Path from Active Management to Fee Attrition
Most families assume that investment costs are visible because management fees appear clearly in quarterly reports. In practice, the highest cost is often hidden within the interaction between portfolio construction, trading activity, and manager behaviour. The process typically develops in four stages.
Stage 1: Benchmark Anchoring
Most active managers begin with a benchmark as a reference point. This is entirely reasonable. Benchmarks provide a framework for measuring performance and controlling risk.
Over time, however, competitive pressures can encourage managers to remain increasingly close to the benchmark. Large deviations create the possibility of significant underperformance, which can lead to client withdrawals, consultant scrutiny, and reputational damage.
The result is a portfolio that remains heavily invested in the same securities as the index while maintaining the appearance of active management.
Stage 2: Active Fees Remain Intact
Although portfolio differentiation declines, the fee structure often remains unchanged.
A manager charging 1.00% annually may hold a portfolio with substantial benchmark overlap. The family continues paying active-management pricing even though a significant portion of the portfolio effectively provides index exposure. This creates a growing disconnect between cost and value.
The manager’s reported fee may appear reasonable in isolation. Viewed through the lens of Active Share, the implied cost of each genuinely active decision becomes substantially higher.
For example, if a portfolio has an Active Share of 40%, the family is effectively paying the full management fee for decisions affecting less than half of the holdings. The cost of each active decision rises substantially even before transaction costs are considered.
Stage 3: Trading Activity Creates Additional Friction
Many managers attempt to justify their active mandate through tactical trading. This introduces a second layer of cost. Every trade involves execution expenses. These include commissions, bid-ask spreads, taxes, and market impact. Market impact refers to the price movement created by the trade itself as orders enter the market.
While individual costs may appear small, their cumulative effect can become material over time. Barber and Odean (2000) concluded that the poor performance of frequent traders could largely be traced to the costs associated with their trading activity.
The family faces two simultaneous expenses:
- Active management fees
- Trading-related implementation costs
Both reduce the share of investment returns that ultimately remains available to support family objectives.
Stage 4: The Compounding Effect
The final stage is rarely visible in any single reporting period. Small annual cost differences compound over years and decades. A portfolio that consistently underperforms its benchmark by 1–2% annually due to fees and implementation costs may still produce positive returns. Trustees may see gains. Family members may see portfolio growth. Advisors may see no immediate reason for concern.
The underlying loss emerges gradually through reduced compounding.
This is the central mechanism of fee attrition. Capital is eroded through a persistent transfer of value from the portfolio to management and implementation costs that exceed the value delivered in return.
Case Study: The Regulatory Challenge to Closet Indexing
Between 2024 and 2025, several European asset managers faced regulatory scrutiny over portfolios that closely tracked their benchmarks while charging active-management fees. Regulators questioned whether investors were receiving the active management they had been promised. In some cases, firms reduced fees or compensated investors after reviews found excessive benchmark overlap. (FCA, 2025; ESMA, 2025).
Why It Remains Hidden
Traditional reporting focuses on outcomes: returns, volatility, benchmark comparisons, and asset allocation all describe what happened. They reveal little about the economic efficiency of the process that produced those outcomes.
A family can therefore monitor performance carefully while remaining unaware that substantial value is being lost through a combination of benchmark overlap, excessive fees, and implementation costs. By the time the problem becomes visible through long-term underperformance, years of compounding have already been lost.
Seeing Beyond the Performance Report
A single metric rarely reveals cost inefficiency. The objective is to move from performance observation to implementation analysis. The following tools create progressively deeper layers of visibility.
1. Active Share Analysis
What it does
Measures how much a portfolio differs from its benchmark and tracks how that differentiation changes over time.
Required inputs
Portfolio holdings, benchmark constituents, position weights, and historical holdings data.
What it reveals
Whether the manager is maintaining a genuinely active portfolio or gradually converging toward the benchmark.
Why it matters
A family paying active management fees should expect active decision-making. Declining Active Share may indicate that the manager is becoming increasingly benchmark-like while maintaining the same fee structure.
Subtleties & Limitations
- Benchmark selection matters – An inappropriate benchmark can distort the results.
- Not a measure of skill – High Active Share does not guarantee outperformance.
- Style-dependent – Certain investment styles naturally exhibit lower Active Share.
- Trend is often more informative than a single observation – A gradual decline may reveal more than a single reporting period.
Active Share tends to be relatively stable over time, making changes in portfolio differentiation particularly informative from a governance perspective. A declining trend may indicate a gradual movement toward benchmark-like behaviour rather than a temporary positioning decision (Anand et al., 2012).
2. Manager Value-for-Money Analysis
What it does
Evaluates the relationship between portfolio differentiation, excess return, and total manager costs.
Required inputs
Active Share, management fees, transaction costs, benchmark returns, and manager alpha.
What it reveals
Which managers are creating value relative to their cost structure and which managers may represent closet indexing risk.
Why it matters
Two managers may generate similar returns while operating with entirely different levels of conviction, cost efficiency, and benchmark overlap.
Subtleties & Limitations
- Requires a meaningful evaluation period – Short-term alpha can be misleading.
- Manager objectives differ – Some mandates prioritise risk control over outperformance.
- Alpha estimation varies by methodology – Different models may produce different results.
- Should be evaluated alongside qualitative factors – Numbers alone do not explain every outcome.
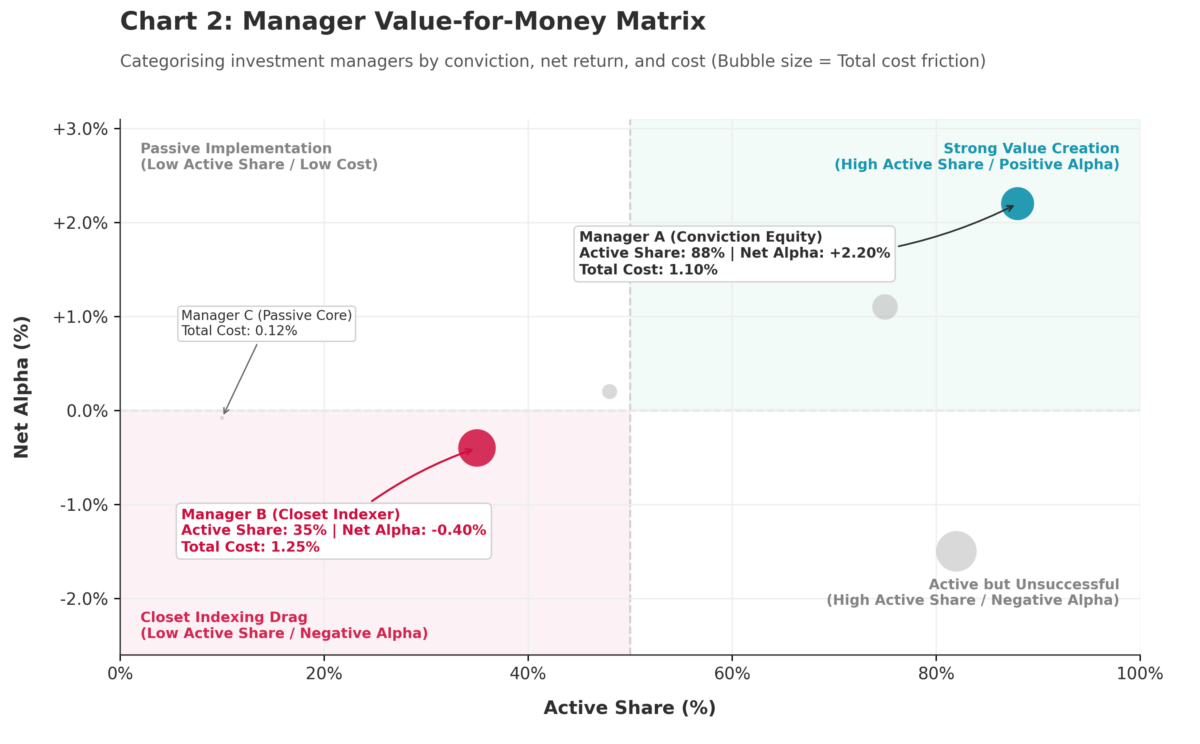
Manager Value-for-Money Matrix
Additional Validation:
Cost-to-Alpha Ratio compares the total cost of a mandate with the excess return generated over a specified period. It helps distinguish managers who create value efficiently from those whose costs consume a substantial portion of their alpha.
Passive Alternative Benchmarking compares the manager’s results against a low-cost passive alternative with similar market exposure. This provides an external reference point for assessing whether active management delivered sufficient value beyond what could have been achieved through passive implementation.
3. Transaction Cost Attribution Analysis
What it does
Measures how much return is lost through implementation costs.
Required inputs
Trading records, commissions, bid-ask spreads, market impact estimates, taxes, and portfolio returns.
What it reveals
How much of the manager’s gross value creation ultimately reaches the family.
Why it matters
Investment ideas may be sound while execution destroys a meaningful portion of the resulting return. Trustees often evaluate investment outcomes without seeing how much performance was lost during implementation.
Subtleties & Limitations
- Data quality is critical – Detailed trading records are required.
- Execution costs vary across markets – Less liquid securities naturally carry higher costs.
- Market conditions influence results – Volatile periods may temporarily increase costs.
- Historical analysis – Explains realised outcomes rather than predicting future returns.
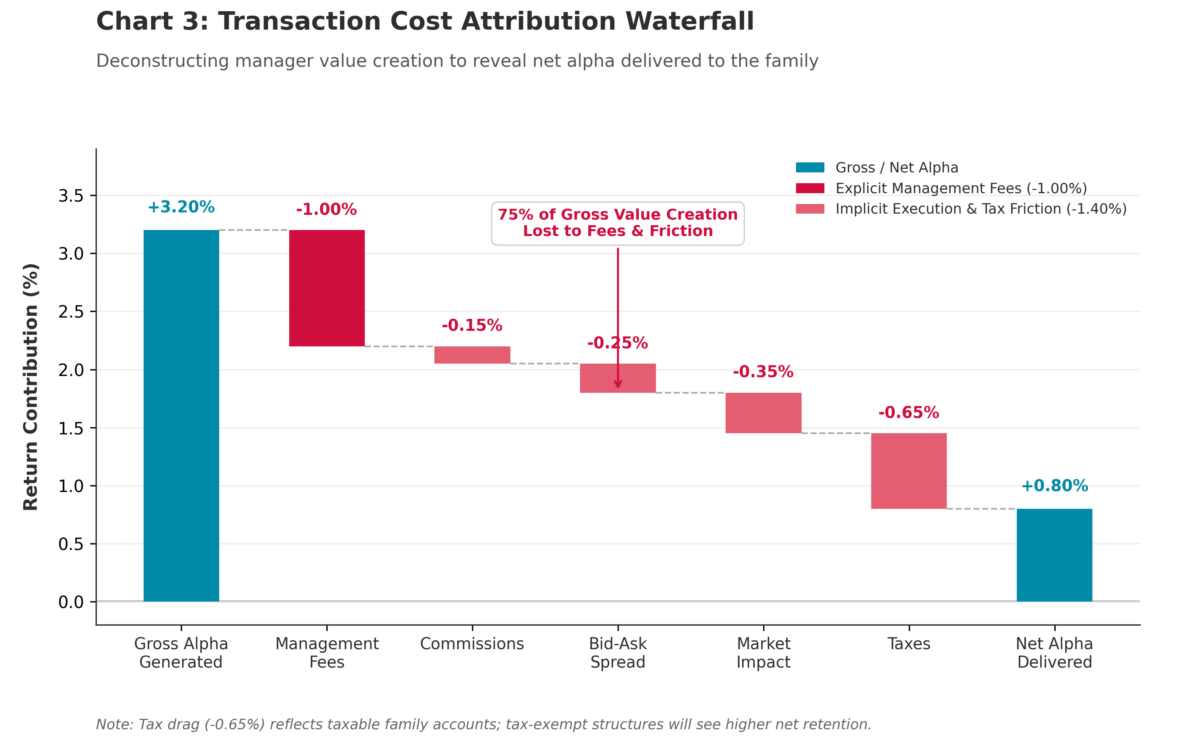
Transaction Cost Attribution Waterfall
Governing the Cost of Alpha
Detecting a problem is only the first step. The governance question is what happens next. Once families understand how fees, benchmark overlap, and implementation costs interact, the discussion shifts from manager evaluation to capital stewardship. The objective is to make certain that every cost has a clear purpose and a measurable contribution to long-term outcomes.
Performance Reporting Is Not Cost Oversight
Most governance frameworks devote substantial attention to performance measurement while treating costs as a secondary consideration. Yet costs are one of the few variables directly observable and controllable by trustees, family councils, and investment committees. A manager may not control market outcomes, but they do control portfolio construction, turnover, and implementation.
Benchmark-relative Success Can Conceal Economic Failure.
A manager can outperform a benchmark by a small margin and still destroy value after accounting for fees and transaction costs. When governance focuses solely on relative returns, it risks rewarding activity rather than value creation. The family receives reports showing success while experiencing incremental erosion of long-term purchasing power.
Incentive Structures Matter As Much As Investment Skill
Fee arrangements influence behaviour. When compensation remains largely disconnected from genuine active management, managers may have limited incentives to maintain portfolio differentiation. Oversight, therefore, extends beyond performance evaluation to incentive alignment and implementation discipline.
Steps to Take
- Calculate the Active Fee
Determine what portion of the management fee applies to genuinely active decisions rather than benchmark exposure. This establishes whether the family is paying an appropriate price for active management. - Establish an Active Share Policy
Define minimum expectations for portfolio differentiation within the Investment Policy Statement. Any material decline should trigger review and discussion. - Review Total Implementation Costs
Examine management fees, transaction costs, custody charges, and other portfolio expenses together rather than in isolation. Economic impact should be assessed on a fully loaded basis. - Introduce Passive Alternative Reviews
Require active managers to demonstrate value relative to realistic passive alternatives. This creates an objective reference point for evaluating cost efficiency. This may also lead to using the performance of ETF’s as benchmark constituents instead of the indices itself. - Create Escalation Triggers
Define governance thresholds for Active Share, turnover, fee-adjusted alpha, or implementation costs. Predetermined triggers reduce the risk that concerns are ignored until underperformance becomes persistent.
Conclusion
The greatest governance failures typically arise from information asymmetry. Managers possess detailed knowledge of portfolio construction, trading activity, implementation choices, and cost structures. Trustees, family councils, and beneficiaries often receive only summary-level reporting focused on outcomes. The resulting imbalance creates blind spots that can persist for years.
Independent reporting creates value by reducing that asymmetry. It protects capital from hidden inefficiencies, identifies value leakage before it compounds, and strengthens the quality of fiduciary decision-making.
Viewed through this lens, it is a governance function rather than an administrative exercise. For families stewarding capital across generations, independent oversight is a minimum fiduciary standard.
Learn more about independent reporting at The Cecily Group Financial Reporting Services.
Stay tuned as we continue unpacking our reporting methodology, and subscribe to our newsletter to follow the full Inside the Data series.
References:
Barber, B.M. and Odean, T. (2000) ‘Trading Is Hazardous to Your Wealth: The Common Stock Investment Performance of Individual Investors’, The Journal of Finance, 55(2), pp. 773–806. Available at: https://faculty.haas.berkeley.edu/odean/papers%20current%20versions/individual_investor_performance_final.pdf
Cremers, K. J. Martijn and Petajisto, Antti, How Active is Your Fund Manager? A New Measure That Predicts Performance (March 31, 2009). AFA 2007 Chicago Meetings Paper, Yale ICF Working Paper No. 06-14, EFA 2007 Ljubljana Meetings Paper, Available at SSRN: https://ssrn.com/abstract=891719 or http://dx.doi.org/10.2139/ssrn.891719
Anand, Amber and Irvine, Paul J. and Puckett, Andy and Venkataraman, Kumar, Performance of Institutional Trading Desks: An Analysis of Persistence in Trading Cost (August 1, 2011). Review of Financial Studies, 2012, Vol. 2 (25), 557-598. , Available at SSRN: https://ssrn.com/abstract=1272040 or http://dx.doi.org/10.2139/ssrn.1272040
French, Kenneth R., The Cost of Active Investing (April 9, 2008). Available at SSRN: https://ssrn.com/abstract=1105775 or http://dx.doi.org/10.2139/ssrn.1105775
Petajisto, Antti, Active Share and Mutual Fund Performance (January 15, 2013). Available at SSRN: https://ssrn.com/abstract=1685942 or http://dx.doi.org/10.2139/ssrn.1685942
ESMA (2025) Supervisory Briefing on the Assessment of Costs in UCITS and AIFs. Available at: https://www.esma.europa.eu/sites/default/files/library/esma34-39-1042_supervisory_briefing_on_the_supervision_of_costs.pdf
GIPS (2020) Global Investment Performance Standards (GIPS®). CFA Institute. Available at: https://www.gipsstandards.org/wp-content/uploads/2021/03/2020_gips_standards_firms.pdf
Visual: Roger de La Fresnaye – The Conquest of the Air