
A family may report a 14% private equity allocation against a 15% target, appearing comfortably within mandate. Yet a private equity expiry ladder — a forward view of expected fund maturities and distributions — may show that a large share of those funds is approaching maturity in the same period, creating a future concentration of distributions and reinvestment needs.
This creates a governance contradiction. The allocation looks balanced today, but the portfolio may already be moving toward temporary over-allocation to cash following concentrated distributions, a reinvestment gap, or a period of concentrated capital calls.
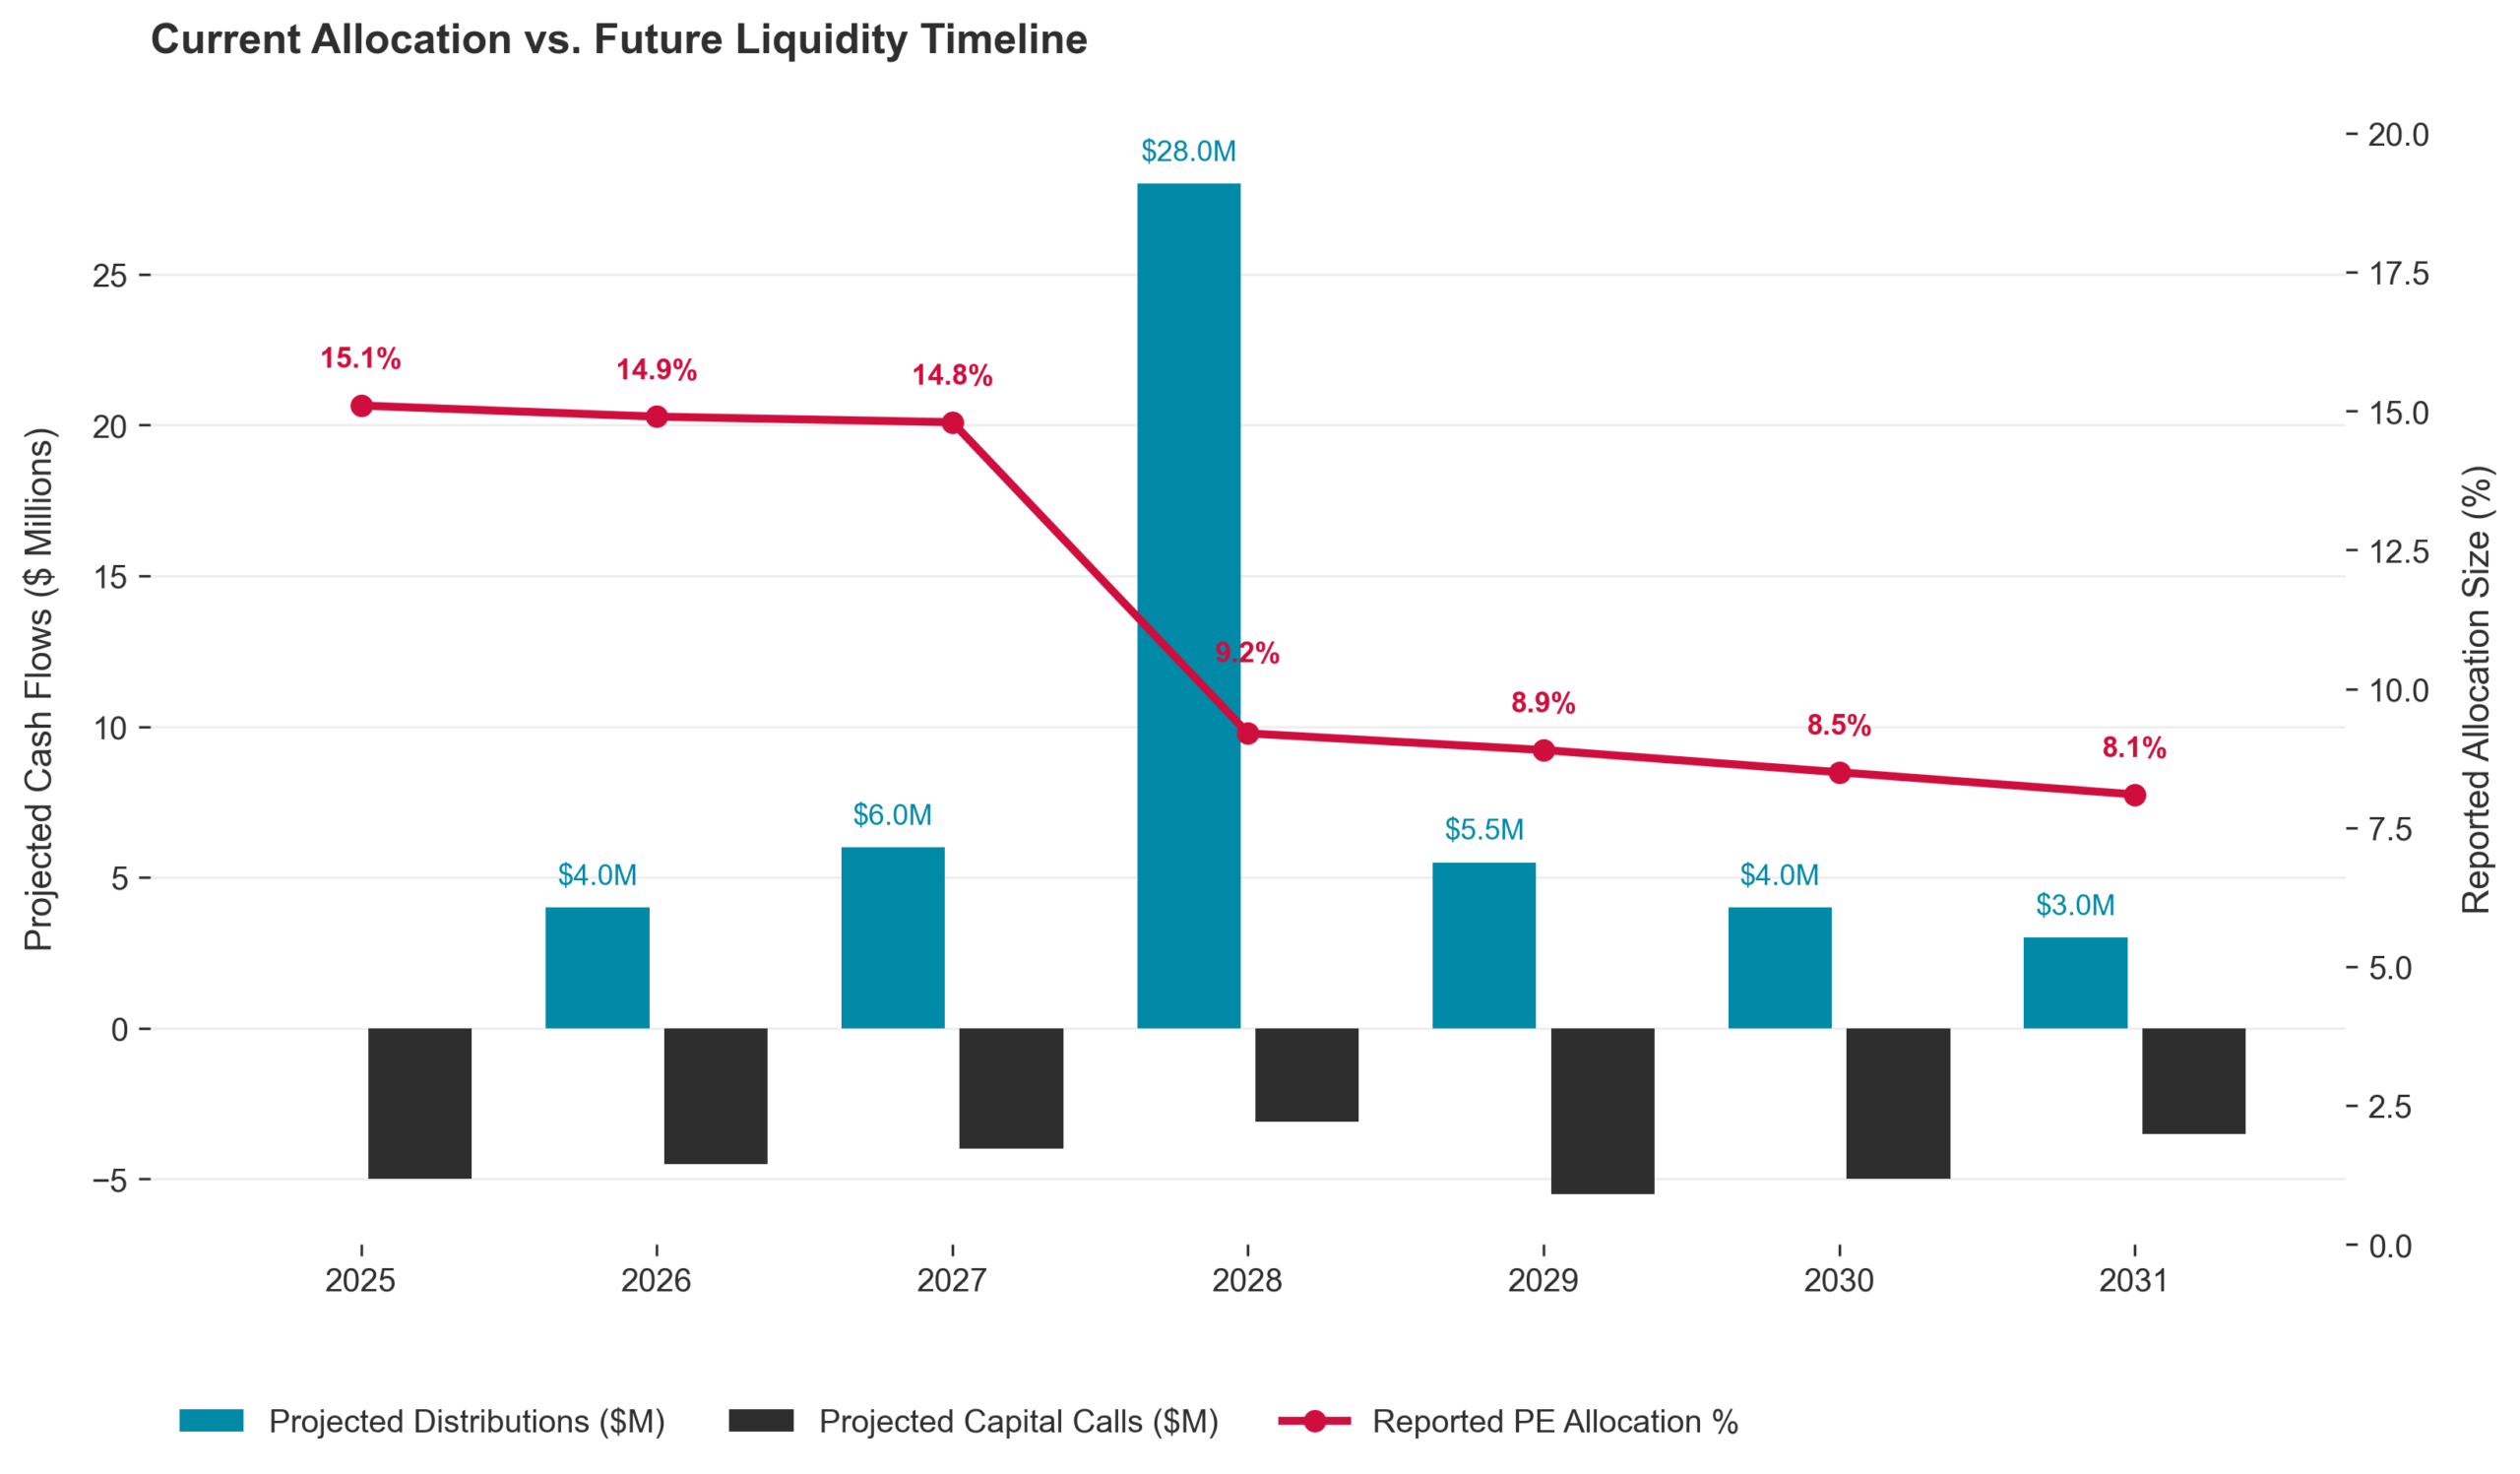
Current Allocation vs Future Liquidity Timeline
Why a Stable Allocation Can Be Misleading
Standard manager reporting often misses this because it focuses on total private equity allocation. This figure answers one question: how much of the portfolio is invested in private equity today? It does not answer the more important governance question: when will capital return, and what decisions will be required when it does?
Specific accounting policies (mark-to-market vs subscription or invested capital) may further cause subtle differences in how these figures show up on a consolidated basis.
A single allocation percentage can obscure vintage concentration, meaning too much capital is committed in the same fund years, and liquidity timing risk, meaning the timing of distributions, extensions, and reinvestment needs becomes uneven across the portfolio. A portfolio can be “on target” now while moving toward future under-allocation because several funds mature or distribute capital at the same time.
This matters because effective private equity oversight extends beyond fund selection. It includes pacing commitments, preparing for future distributions, and coordinating liquidity requirements with family priorities, tax considerations, philanthropic goals, and long-term capital planning.
Most reports are created by the same institutions managing or administering the assets, which can leave families with allocation figures but limited insight into timing, commitments, and liquidity exposure. Independent reporting consolidates data across managers and portfolios, turning fragmented fund information into a clearer basis for oversight, pacing, and accountability.
Why “We’re Within Allocation” Is Not a Liquidity Plan
Managers rarely dispute the numbers. The defence focuses on timing and assumptions.
“The fund has a 10-year term”
The manager argues that liquidity planning is unnecessary because the expected expiry date is already known.
This assumes private equity exits occur predictably and on schedule. In practice, distributions are uneven. Some funds return capital rapidly in years 4–7, while others remain extended well beyond their original maturity through GP extension options or delayed exits. Research on private equity cash-flow modelling shows that fund behaviour varies significantly across vintages and market cycles, making deterministic forecasting unreliable (Kieffer et al., 2023).
“We will reinvest distributions as they arrive”
The manager argues that future allocation stability can be maintained simply by recommitting returned capital.
This overlooks the pacing problem. High-quality private equity opportunities are not continuously available, and manager selection processes often require 12–18 months of sourcing, diligence, and approval. Waiting for distributions before planning commitments increases the likelihood of being under-invested during future investment cycles. Research on private equity portfolio construction suggests that commitment rhythm is often more important than the selection of any single fund vintage (Rabe, 2016).
“The allocation remains within mandate”
The manager points to the current allocation percentage as evidence that the portfolio remains properly balanced.
This confuses current allocation with dynamic liquidity management. A portfolio can remain within target while distributions, unfunded commitments, and extension risk gradually reshape its liquidity profile underneath the surface.
Each defence treats private equity as a current allocation, not as a long-duration cash-flow system.
If the allocation percentage appears stable, how do liquidity gaps and reinvestment pressures accumulate without becoming visible in standard reporting?
How Private Equity Liquidity Drift Accumulates
The distortion begins with the difference between allocation measurement and cash-flow timing.
Private equity allocation measures how much capital is currently invested. An expiry ladder measures when capital is likely to return and when new commitments will be required. The first creates a static snapshot. The second reveals the portfolio’s future liquidity path.
This creates the condition for false stability: a private equity allocation can appear balanced today while the underlying timing of distributions, extensions, and commitments is already creating future liquidity and reinvestment pressure.
The process typically develops in four stages.
1. Commitments cluster into the same vintages
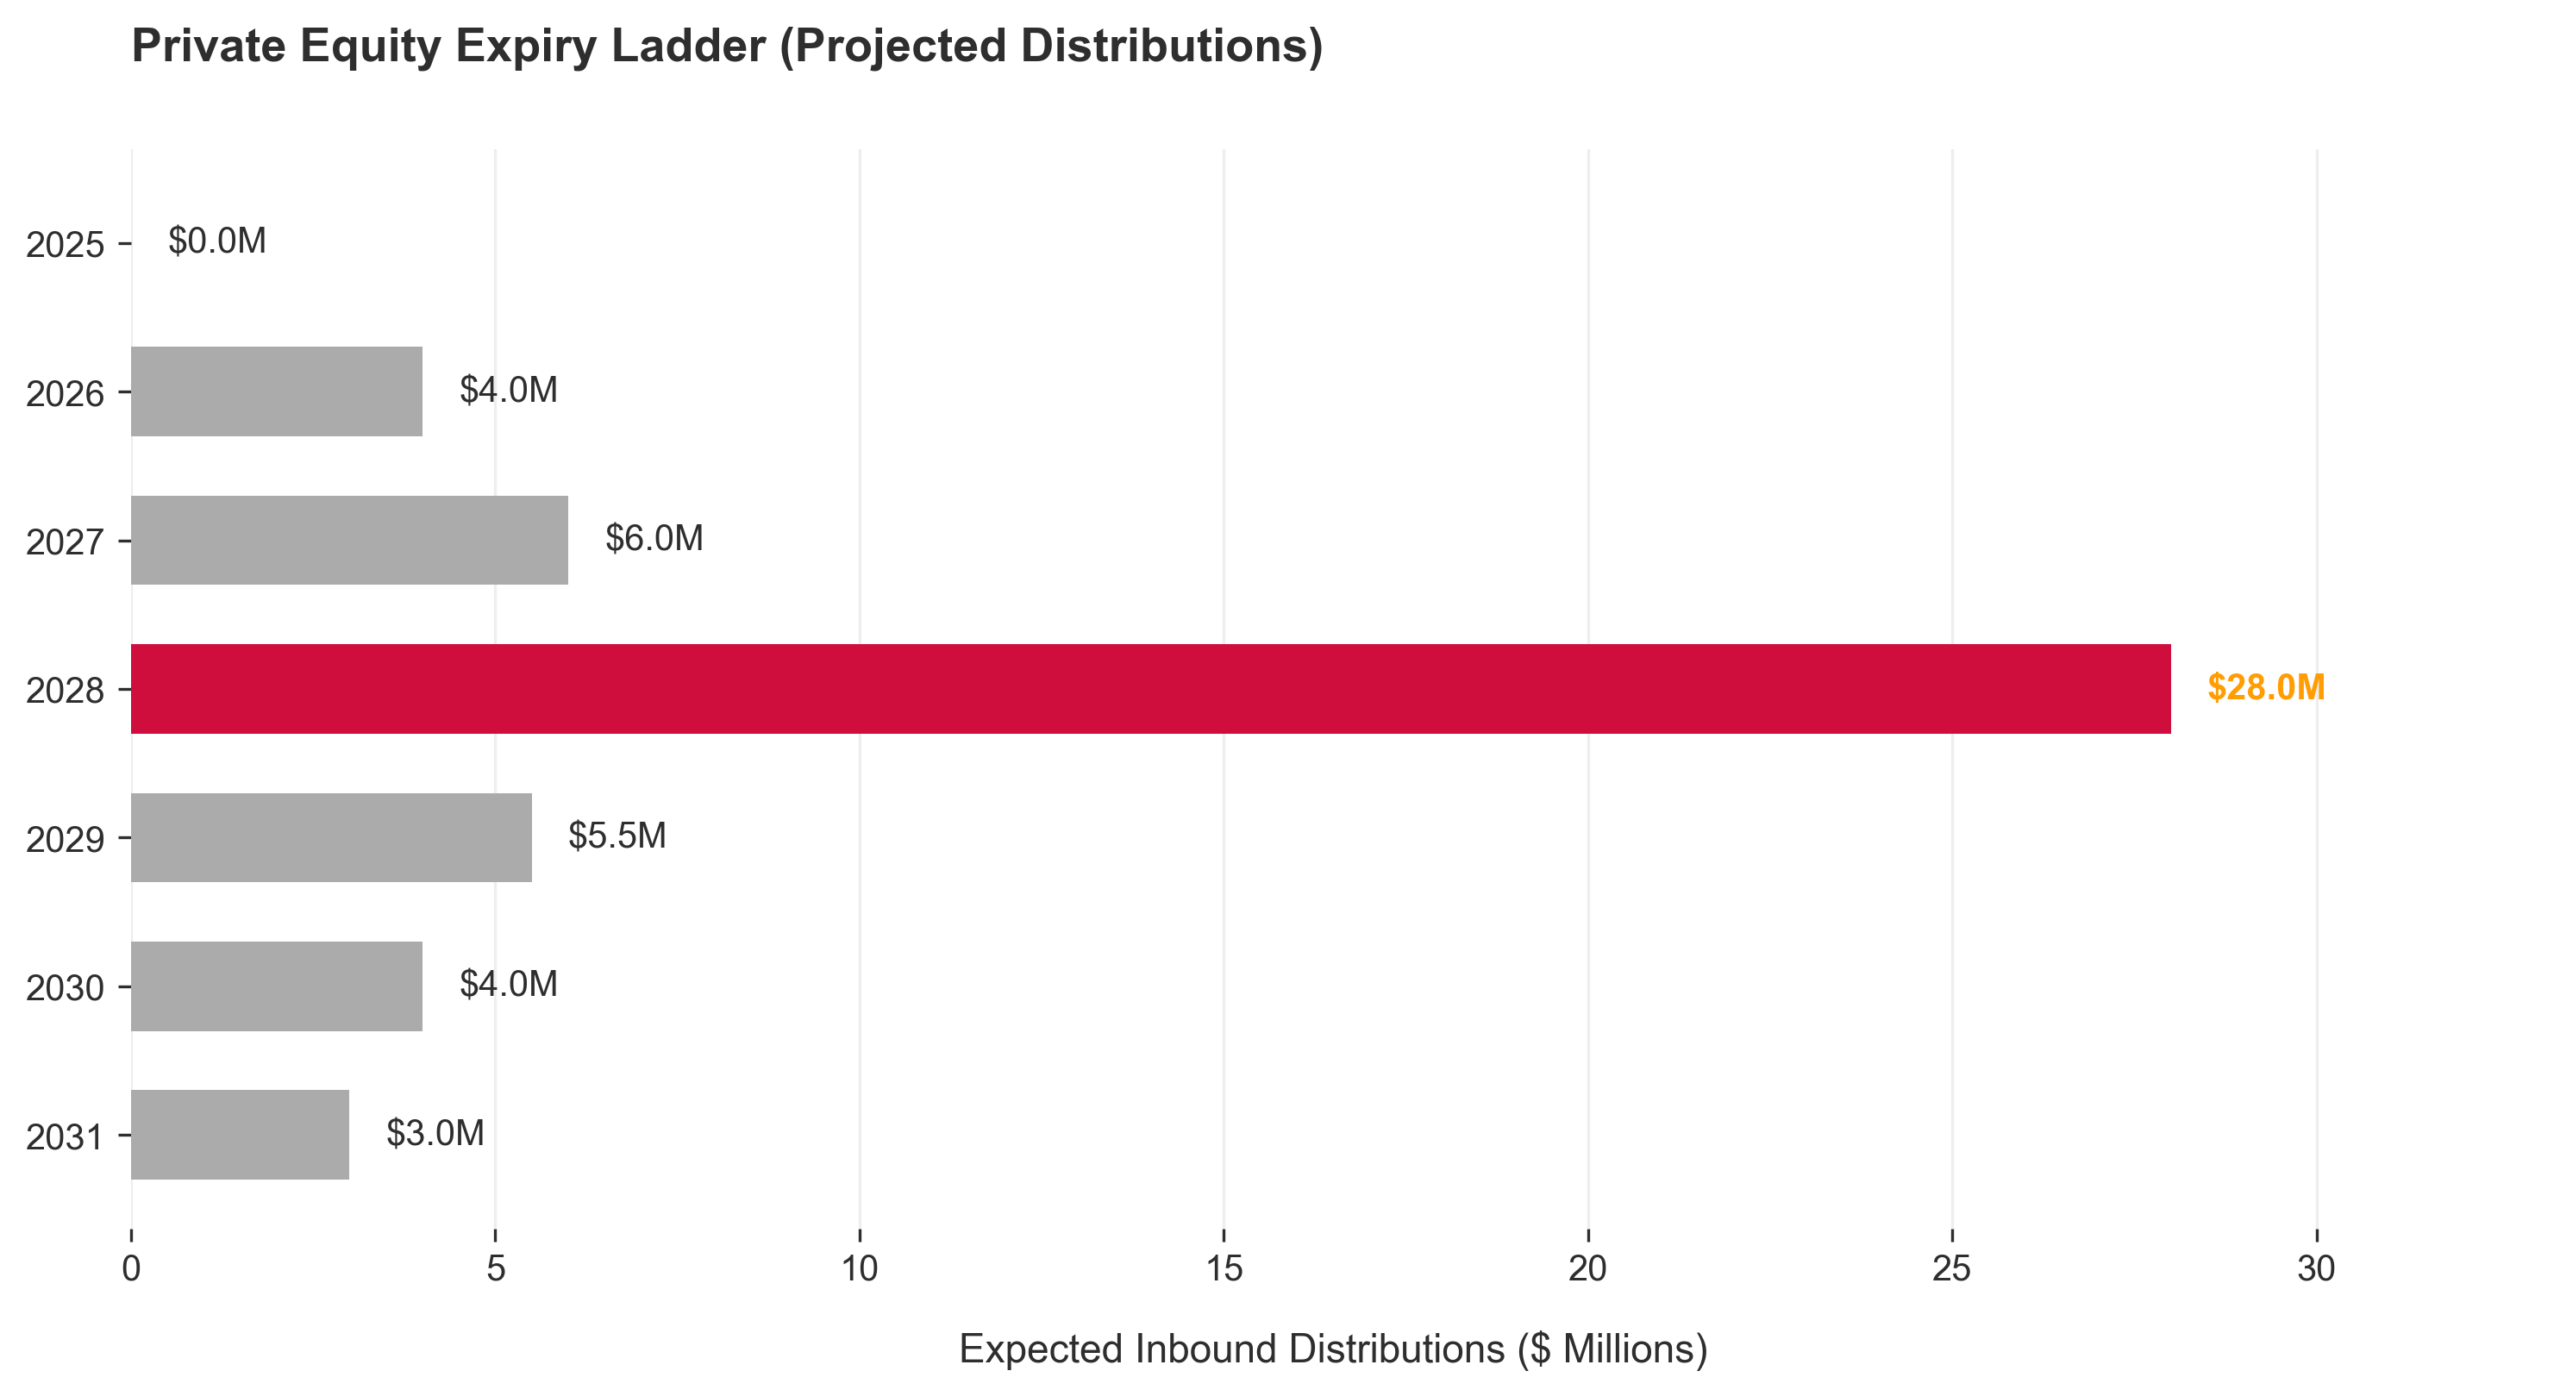
Private Equity Expiry Ladder
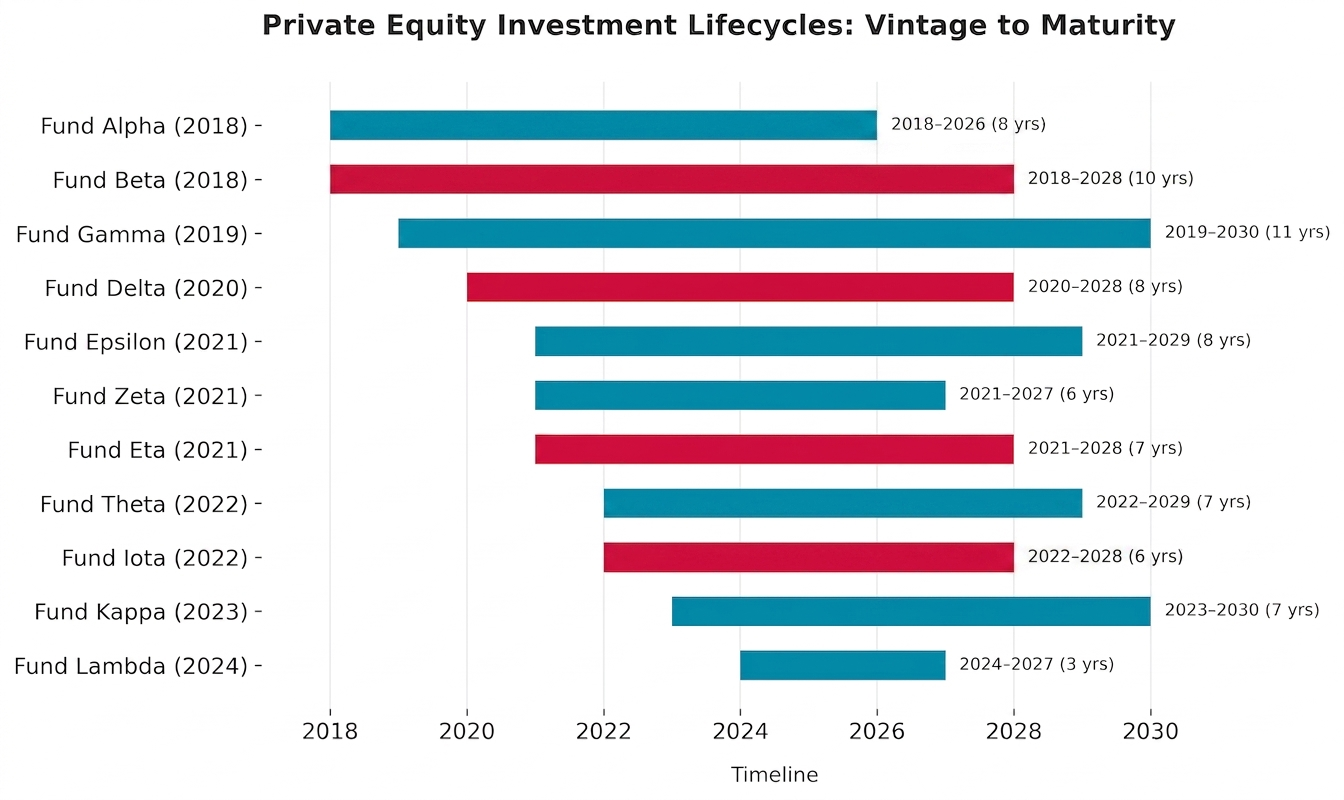
Families often commit capital heavily during periods of strong private equity performance or favourable fundraising conditions.
This can create vintage concentration, where too many funds share similar investment and exit timelines. The portfolio may appear diversified by manager or strategy while remaining highly dependent on the same future liquidity cycle.
Research on private equity portfolio construction shows that investment rhythm across vintages materially influences portfolio risk and liquidity stability (Rabe, 2016).
2. Allocation percentages remain stable while liquidity dynamics change
Private equity valuations adjust slowly relative to public markets. As a result, allocation percentages can appear stable even while:
- distributions accelerate,
- unfunded commitments remain high,
- or mature funds approach expiry simultaneously.
The portfolio still looks stable because the reporting framework focuses on current NAV instead on expected future cash flows.
3. Reinvestment timing becomes compressed
As distributions begin arriving in concentrated periods, the family must simultaneously:
- source new managers,
- evaluate commitments,
- manage capital calls,
- and maintain target allocation.
This creates the pacing gap: the delay between receiving distributions and identifying suitable new commitments.
Research on recommitment strategies suggests that deterministic cash-flow assumptions often underestimate the variability of actual private equity distributions and drawdowns (Kieffer et al., 2023).
4. Liquidity pressure emerges during market stress
The timing mismatch becomes most visible during adverse markets.
During the 2008 financial crisis, private equity exit plans were disrupted as market turbulence delayed public offerings and liquidity events. KKR, for example, postponed its planned $15bn listing amid “extraordinary turbulence” in global markets. For limited partners, this illustrates the broader governance risk: expected liquidity can shift quickly when exit markets weaken, making pacing plans and expiry ladders essential. (Clark and Bowers, 2008).
The J-Curve Reinvestment Trap
The mechanism becomes more severe when concentrated distributions are followed by rapid recommitment.
New private equity investments typically enter the J-Curve phase, where early fees and expenses outweigh realised returns. If several mature funds distribute capital simultaneously, families may experience:
- temporary cash drag,
- reduced portfolio yield,
- and overlapping J-Curve effects from newly committed funds.
This creates a structural liquidity transition where the portfolio can appear well-capitalised while long-term return generation temporarily weakens.
At this stage, the issue is no longer simply allocation management. It becomes a governance problem affecting liquidity planning, pacing discipline, and the family’s ability to maintain long-term private market exposure across cycles. It also exposes any lack of patient capital that is required for private equity investments.
How to See the Liquidity Timeline Behind the Portfolio
Current allocation reporting is useful for measuring exposure at a single point in time. Detecting pacing and liquidity risk requires analysis that tracks commitments, capital calls, and distributions across multiple years.
1. Private Equity Expiry Ladder
What it does:
Maps the portfolio’s future liquidity timeline by projecting expected fund maturities and distributions across future years.
Required inputs:
Fund vintage years, expected maturity dates, extension rights, and projected distribution schedules.
What it reveals:
Whether distributions are diversified across time or concentrated into specific future periods.
Why it matters:
It identifies future liquidity walls before they emerge, allowing the family office to plan reinvestment pacing and liquidity reserves proactively.
Subtleties & Limitations:
- Exit timing assumptions may change materially during market stress
- GP extension rights can significantly delay expected distributions
- Forecast accuracy declines over longer horizons
2. Commitment Lifecycle Matrix

Commitment Lifecycle Matrix
What it does:
Tracks each fund from commitment through distribution and maturity:
- commitment,
- drawdown,
- harvest,
- and extension phase.
Required inputs:
Commitment dates, capital called, NAV, DPI (Distribution to Paid-In), and remaining unfunded commitments.
What it reveals:
Whether the portfolio is concentrated in early-stage drawdown periods, mature harvest periods, or ageing extension-risk funds. At early maturity stages, it’s typical that the PE has a hockey-stick shape, but that’s not indicative of the overall future performance.
Why it matters:
It distinguishes stable long-term pacing from clustered commitment behaviour that may destabilise future liquidity.
Subtleties & Limitations:
- DPI progression varies significantly across strategies
- Mature funds may still hold illiquid assets despite high realised distributions
- Requires consistent manager reporting standards
3. Vintage Concentration Analysis
What it does:
Measures how private equity exposure is distributed across commitment years.
Required inputs:
Fund vintage years, commitment amounts, and portfolio allocation data.
What it reveals:
Whether the family is overly exposed to a single fundraising or exit cycle.
Why it matters:
Vintage diversification reduces the risk that large portions of the portfolio become illiquid or distributable simultaneously.
Subtleties & Limitations:
- Vintage diversification alone does not eliminate sector or strategy concentration
- Older vintages may still carry extension risk
- Some concentrated vintages may reflect deliberate tactical positioning
4. Unfunded Commitment Stress Testing
What it does:
Evaluates whether the family can meet future capital calls under stressed market conditions and in view of planned distributions to the family.
Required inputs:
Unfunded commitments, expected drawdown schedules, liquid asset reserves, and public market stress assumptions.
What it reveals:
Whether the family may struggle to meet future capital calls during stressed markets, during periods when capital calls increase, and public market liquidity weakens simultaneously.
Why it matters:
Research on liquidity spirals shows that funding stress and market illiquidity often reinforce each other during crises (Brunnermeier & Pedersen, 2008).
Subtleties & Limitations:
- Stress assumptions may not capture extreme market dislocation
- Capital call timing remains inherently uncertain
- Requires consolidated visibility across all family liquidity sources
Turning Private Equity into a Governable Cash-Flow System
Private equity governance weakens when allocation targets replace liquidity planning.
Current allocations can conceal future liquidity imbalance.
A portfolio may appear appropriately invested today while already moving toward concentrated distributions, extension exposure — where funds remain active beyond their expected maturity — or reinvestment gaps.
Commitment pacing becomes more important as allocations grow.
As private market exposure increases, governance must shift from reviewing historical returns toward managing future cash-flow timing.
Liquidity risk extends beyond private equity itself.
Unfunded commitments interact directly with public market stress, tax obligations, operating businesses, and family spending needs.
Steps to Take
- Request a Multi-Year Expiry Ladder
Review expected distributions and fund maturities across at least the next five years rather than relying only on current allocation percentages. - Review Unfunded Commitments Separately from NAV
Track remaining contractual obligations independently from reported private equity valuations. - Monitor GP Extension Exposure
Identify funds approaching years 8–10 and assess whether managers have indicated possible extension requirements. - Build a Commitment Pacing Plan
Determine annual commitment targets required to maintain long-term allocation stability across different market environments. - Align Private Equity Timing with Family Liquidity Needs
Coordinate expected distributions and capital calls with tax planning, philanthropy, operating business requirements, and intergenerational wealth transfers.
Independent Reporting
The value of reporting lies not only in measuring current allocation, but in revealing how liquidity, commitments, and distributions evolve over time.
This is the reporting premium: reducing information asymmetry between asset owners and managers by viewing private equity not as a current allocation, but as a long-term system of commitments, distributions, and liquidity needs.
At a governance level, independent oversight is a minimum fiduciary standard.
See how independent reporting can strengthen your oversight:
https://thececilygroup.com/financial-reporting/
Stay tuned as we continue unpacking our reporting methodology, and subscribe to our newsletter to follow the full Inside the Data series.
Visual: Diego Rivera – The Alarm Clock.
References
Clark, A. and Bowers, S. (2008) ‘KKR delays $15bn float amid “extraordinary turbulence”’, The Guardian, 3 November. Available at: https://www.theguardian.com/business/2008/nov/03/kkr-flotation-delay.
Brunnermeier, M.K. and Pedersen, L.H. (2008) ‘Market liquidity and funding liquidity’, Review of Financial Studies, 22(6), pp. 2201–2238. Available at: https://doi.org/10.1093/rfs/hhn098
Kieffer, E., Meyer, T., Gloukoviezoff, G., Lucius, H. and Bouvry, P. (2023) ‘Learning private equity recommitment strategies for institutional investors’, Frontiers in Artificial Intelligence, 6. Available at: https://doi.org/10.3389/frai.2023.1014317
Rabe, T. (2016) Are Private Equity Funds of Funds Managed by More Risk-Tolerant Private Equity Firms Necessarily More Risky? Master’s thesis. Copenhagen Business School. Available at: https://www.vernimmen.net/ftp/20160630_RabeTorben_Thesis.pdf