
A portfolio can remain within a ±0.5% monthly performance deviation limit while its rolling tracking error rises over several quarters. In plain terms, the manager may “pass” each monthly check while the portfolio steadily begins to behave less like the mandate it was hired to follow. This creates a governance contradiction. The report shows compliance, but the risk profile is changing.
The Reporting Gap
A portfolio can remain within a ±0.5% monthly performance deviation limit while its rolling tracking error rises over several quarters. In plain terms, the manager may “pass” each monthly check while the portfolio steadily begins to behave less like the mandate it was supposed to be. This creates a governance contradiction. The report shows compliance, but the risk profile is gradually changing.
Yet, it obscures the difference between an isolated event and a persistent change in portfolio behaviour. A one-month or four quarterly deviations (both up and down) may reflect market noise, short-term volatility, or temporary trading effects. Rising tracking error, defined as the volatility of excess returns relative to a benchmark, may indicate that the portfolio is taking more or less active risk than the mandate intended.
This distinction matters because governance should monitor both outcome and process. A manager can avoid obvious breaches while gradually increasing exposure to different factors, sectors, styles, or risk levels. The dashboard may continue to indicate compliance while the mandate exposure changes.
Most reports are created by the same institutions managing the assets, which can leave families with performance figures but limited insight into underlying risk, costs, and exposures. Independent reporting consolidates data across managers and portfolios, turning fragmented figures into a clearer basis for oversight and accountability.
When Monthly Compliance Hides Structural Transformation
Managers rarely dispute the numbers. The defence focuses on interpretation.
“It was just a fat-tail event”
The deviation is presented as an isolated market anomaly that will naturally mean-revert.
This may be true for a single month. However, if rolling tracking error continues to rise over successive quarters, the issue is no longer noise: it starts to become a trend. It indicates that the portfolio’s behaviour is changing in a persistent way. Structural divergence from a benchmark is often visible in tracking error trends before it becomes obvious in headline performance.
“We are taking conviction positions”
The manager argues that temporary increases in active risk are necessary to generate excess return or recover recent underperformance.
This defence assumes that additional risk-taking falls within the original governance agreement. Behavioural finance research shows that managers facing performance pressure often increase risk exposure to “catch up,” particularly near reporting periods (Brown, Harlow & Starks, 1996). Without explicit approval, this shifts the mandate beyond its intended risk budget.
“The monthly limit was not breached”
The manager remains technically compliant because each monthly deviation stays within policy thresholds.
This confuses event monitoring with behavioural monitoring. Static limits capture isolated breaches but fail to identify gradual changes in portfolio construction. A manager can remain within the threshold while gradually altering factor exposures, style profile, or active risk.
Each defence treats compliance as a monthly outcome. If isolated deviations are being monitored but changes in portfolio behaviour remain hidden, what mechanism allows mandate drift to accumulate without triggering governance alarms?
How Rolling Tracking Error Reveals Mandate Drift
The distortion begins with the difference between event monitoring and behaviour monitoring.
Absolute deviation measures what happened in a single period. Rolling tracking error measures how consistently the portfolio behaves differently from its benchmark over time. The first captures isolated incidents. The second captures evolving portfolio character.
This creates the condition for false compliance: static deviation checks can show continuous “pass” results while the portfolio gradually drifts away from the mandate’s intended risk profile.
The process unfolds in three steps:
1. Incremental changes in positioning
Managers gradually alter exposures in pursuit of performance. This may involve shifting from Value toward Growth, increasing mid-cap exposure, concentrating sectors, or taking larger active positions relative to the benchmark.
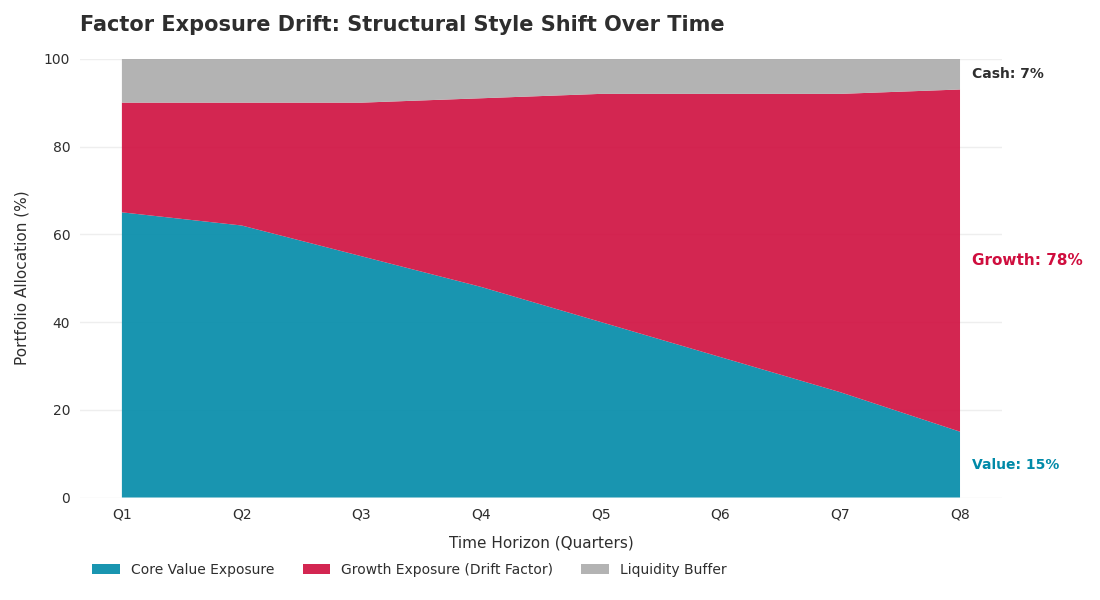
Style / Factor Exposure Drift Over Time Chart
Each change appears manageable in isolation. Monthly deviations remain small enough to avoid triggering threshold alerts.
2. The risk profile changes before the performance does

Rolling Tracking Error vs Monthly Deviation Chart
Because tracking error measures the volatility of excess returns over time, it captures changes in how the portfolio behaves relative to the benchmark.
A rising rolling tracking error indicates that the manager is taking increasingly differentiated positions. As Wermers (2000) observed, apparent outperformance is often driven not by stock selection skill, but by shifts in style and factor exposure. This is especially relevant to observe when the asset manager responsible for the portfolio changes hands within the asset management company. In portfolios managed by banks, it is not unusual to see a change of asset manager every three to five years as the colleagues move on or leave. More subtle is when investment management committees change that are one or two levels removed from the asset manager.
The portfolio may still appear within mandate limits, but its underlying risk profile is changing.
3. Diversification assumptions break down
As style drift accumulates, the portfolio can begin overlapping with risks already present elsewhere in family wealth structures.
The issue becomes a governance problem affecting total (consolidated) portfolio construction, diversification, and risk budgeting.
During the late stages of the dot-com era (1998–2000), many traditional Value and “core” equity managers gradually increased exposure to high-growth Technology stocks to keep pace with market benchmarks and peer performance. Monthly deviations often remained unremarkable, but underlying sector concentration increased materially. When the NASDAQ collapsed, investors discovered that many ostensibly diversified mandates had already drifted into the same concentrated Technology exposures they were intended to offset (Kacperczyk, Sialm & Zheng, 2005; U.S. Securities and Exchange Commission, Historical Archive).
Unfortunately, but not unexpectedly, we are seeing a similar phenomenon developing currently in the private credit market.
The Hidden Layer: Uncompensated Active Risk
This mechanism becomes critical when viewed through the relationship between tracking error and information ratio.
The information ratio measures whether the manager is being “paid” in excess return for the additional active risk being taken.
A rising tracking error accompanied by a falling information ratio signals that:
- the manager is taking more differentiated risk,
- without generating proportionately better returns.
Because standard reporting often focuses on performance outcomes, this deterioration can continue for extended periods without formal challenge. The result is a reporting framework that monitors visible breaches while missing gradual changes in the portfolio’s strategic profile.
How to Detect Drift Before It Becomes a Breach
Static compliance checks are useful for identifying isolated exceptions. Detecting structural drift requires a different layer of analysis.
1. Rolling Tracking Error Trend Analysis
What it does:
Measures how consistently portfolio returns diverge from the benchmark over time.
Required inputs:
Portfolio returns, benchmark returns, and a rolling time window (typically 24 months).
What it reveals:
Whether the manager’s active risk profile is becoming more aggressive, concentrated, or differentiated from the original mandate.
Why it matters:
It distinguishes between temporary deviations and persistent behavioural change.
Subtleties & Limitations:
- Sensitive to benchmark selection
- Short rolling periods can exaggerate temporary volatility
- Low tracking error can also indicate “closet indexing” rather than disciplined risk control
2. Tracking Error vs Information Ratio Comparison
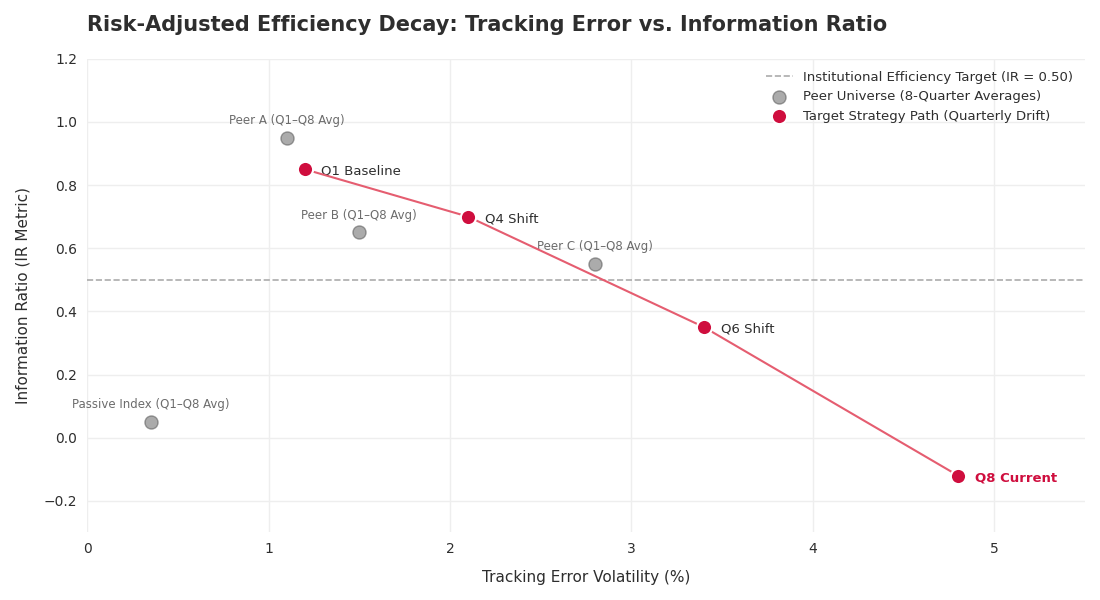
Tracking Error vs Information Ratio Scatter Plot
What it does:
Compares the amount of active risk being taken with the excess return generated from that risk.
A rising rolling tracking error indicates that the manager is taking increasingly differentiated positions. As Wermers (2000) demonstrated, performance differences are often influenced by shifts in style and factor exposure alongside stock-selection decisions.
Recent research also highlights that high tracking error alone is not evidence of conviction; without corresponding excess return, it may simply reflect inefficient active risk-taking (Lazard Asset Management, 2026).
Required inputs:
Tracking error, active return, benchmark return history.
What it reveals:
Whether increased risk-taking is producing efficient outcomes or simply increasing portfolio volatility.
Why it matters:
A rising tracking error combined with a weakening information ratio indicates deteriorating risk efficiency.
Subtleties & Limitations:
- Information ratios can be distorted over short periods
- Strong market regimes may temporarily reward excessive risk-taking
3. Factor Exposure Drift Monitoring
What it does:
Tracks changes in portfolio exposure to styles, sectors, market capitalisation, or other risk factors over time.
Required inputs:
Holdings-level data and factor attribution analysis.
What it reveals:
Whether the manager is gradually moving away from the intended investment style.
Why it matters:
Style drift often appears in factor exposures before it becomes visible in performance deviations.
Subtleties & Limitations:
- Requires granular holdings data
- Factor definitions can vary between providers
4. Rolling Behaviour vs Static Threshold Comparison
What it does:
Compares rolling behavioural indicators with static compliance limits.
Required inputs:
Monthly deviation reports alongside rolling tracking error history.
What it reveals:
Whether the portfolio remains technically compliant while its behaviour changes materially.
Why it matters:
It tests whether governance frameworks are monitoring process consistency or merely checking isolated events.
Subtleties & Limitations:
- Requires consistent historical reporting
- Thresholds may need adjustment across different mandate types
V. From Detection to Governance Action
Once identified, these distortions carry direct implications for oversight, manager accountability, and portfolio construction.
Static limits create a false sense of control
Monthly thresholds provide reassurance because they are simple to monitor. However, they often detect isolated incidents rather than evolving changes in manager behaviour.
Mandate drift weakens diversification
When managers gradually alter style exposures or active risk profiles, family portfolios can become unintentionally concentrated in the same underlying factors.
Unmonitored active risk changes the governance agreement
A rising tracking error without formal review means the effective mandate has changed, even if the written mandate has not.
Steps to Take
- Monitor Rolling Tracking Error Alongside Monthly Deviations
Require managers to present rolling tracking error trends in every quarterly review, not only isolated monthly compliance results. - Introduce Soft Risk Budget Limits
Define acceptable tracking error ranges within the Investment Policy Statement (IPS), with escalation triggers for persistent increases in the Rolling Tracking Error. - Review Tracking Error Together with Information Ratio
Assess whether additional active risk is producing proportionate excess return or simply increasing volatility. - Monitor Factor Exposure Consistency
Track changes in style, sector, and factor exposure to identify gradual mandate drift before it becomes visible in performance. - Escalate Persistent Behavioural Change
If rolling tracking error exceeds agreed ranges over consecutive periods, trigger a formal mandate review rather than treating each month independently.
Independent Reporting
Independent reporting reduces information asymmetry between asset owners and asset managers. It reveals whether a manager is behaving consistently with the agreed mandate and risk framework. It protects governance integrity, diversification, and risk discipline.
See how independent reporting can strengthen your oversight: https://thececilygroup.com/financial-reporting/
Stay tuned as we continue unpacking our reporting methodology, and subscribe to our newsletter to follow the full Inside the Data series.
Image: Lyubov Popova – Portrait of a Philosopher
References:
Brown, K.C., Harlow, W.V. and Starks, L.T. (1996) ‘Of tournaments and temptations: An analysis of managerial incentives in the mutual fund industry’, The Journal of Finance, 51(1), pp. 85–110.
Kahneman, D. and Tversky, A. (1979) ‘Prospect theory: An analysis of decision under risk’, Econometrica, 47(2), pp. 263–292. Available at: https://doi.org/10.1111/j.1540-6261.1996.tb05203
U.S. Securities and Exchange Commission (SEC) (n.d.) Investment Advocacy and the Dot-Com Bubble (Historical Archive). Available at: https://www.sec.gov.
Lazard Asset Management (2026) Tracking Error: Myth vs. Reality. Available at: https://www.lazardassetmanagement.com/at/de_de/research-insights/investment-insights/investment-research/tracking-error.
Wermers, R. (2000) ‘Mutual fund performance: An empirical decomposition into stock-picking talent, style, transaction costs, and expenses’, The Journal of Finance, 55(4), pp. 1655–1695. https://doi.org/10.1111/0022-1082.00263