

74/100. On an aggregate ESG scorecard, the portfolio appears aligned with a sustainable investment mandate. One number seems to answer the complex governance question: is the portfolio truly sustainable?
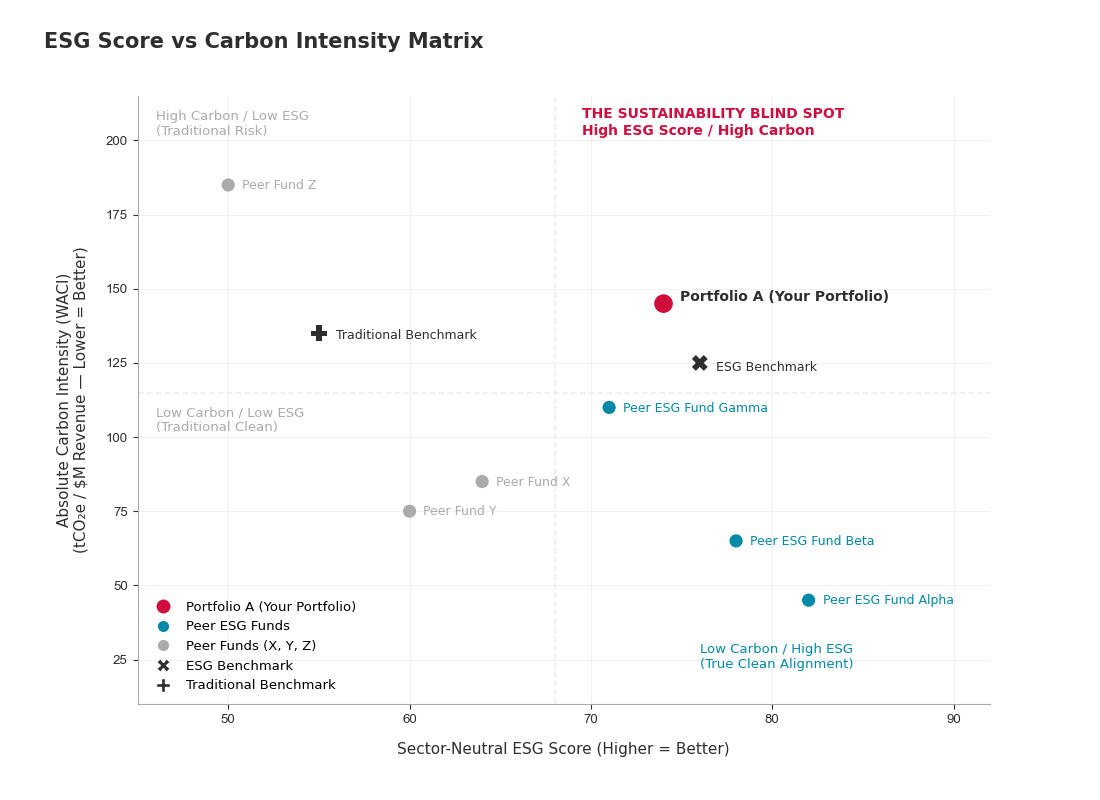
ESG Score vs Carbon Intensity Matrix
The apparent simplicity is also its greatest limitation. ESG scores are often sector-neutral, meaning a company may score well relative to peers in the same sector even when the sector itself carries high transition, litigation, or reputational risk (ESMA, 2026). A high portfolio score may reflect sector allocation, disclosure quality or company size rather than real sustainability or alignment with the family’s stated values (Banque de France, 2026).
Standard manager reporting rarely reveals this tension. The manager can present the portfolio as “above average” on sustainability, while providing little information about how the score was achieved, which holdings carry the risk, or whether the result stems from active ESG selection or a passive tilt toward sectors that naturally score well.
This matters because ESG oversight is a mandate-integrity issue. If a family office cannot distinguish between a portfolio that manages sustainability risk and a portfolio that manages the appearance of sustainability, it cannot hold the manager properly accountable.
The Comfortable Explanations
Managers rarely defend an ESG portfolio by arguing against sustainability. Instead, they defend the measurement framework itself.
Defence 1: “We use a best-in-class approach to maintain diversification.”
The argument is reasonable: excluding entire sectors may create concentration risk and reduce investment flexibility. The problem is that relative ranking does not eliminate absolute risk. A company can be the highest-rated firm in a carbon-intensive sector while remaining exposed to the same transition pressures affecting the industry as a whole. In periods of structural change, sector-level risks often dominate company-level differences (ESMA, 2026).
The relevant governance question is whether the underlying exposure remains consistent with the mandate.
Defence 2: “ESG ratings differ across providers, so the scores should not be taken too literally.”
Different methodologies can produce materially different ratings for the same company because providers use different assessment frameworks and weighting approaches.
However, disagreement over ratings does not invalidate the underlying data. Carbon emissions, regulatory violations, labour disputes, board composition, and governance controversies remain observable facts. The existence of measurement differences makes underlying portfolio exposures more important to examine. For governance purposes, the question becomes straightforward: if the ratings are subjective, what do the underlying metrics actually show?
Defence 3: “The portfolio’s ESG score remains above benchmark.”
Benchmark outperformance appears reassuring because it suggests progress relative to the market. Yet benchmarks can obscure the source of that advantage. Research examining labelled sustainable funds found that many ESG portfolios achieved lower carbon footprints primarily through broad allocation effects rather than superior sustainability selection. Remarkably, a significant proportion of non-labelled funds exhibited lower carbon intensity than funds carrying sustainable labels (Banque de France, 2026).
A score above the benchmark may therefore indicate positioning rather than skill. If aggregate scores, relative rankings, and benchmark comparisons all have limitations, a more important question emerges: How does a portfolio gradually move away from its stated sustainability mandate while continuing to appear compliant on every dashboard?
When the Score Becomes the Strategy
Managers operate in an environment where sustainability mandates are increasingly scrutinised by clients, regulators, and beneficiaries. While performance and ESG scores are clearly visible, portfolio construction can stay relatively hidden.
The easiest way to improve a portfolio’s aggregate ESG profile is often through allocation decisions that naturally produce higher scores. The process typically develops in four stages.
Stage 1: The Search for Better Scores
The manager seeks to strengthen the portfolio’s ESG profile without materially altering return expectations. This can lead investments toward sectors and companies that naturally receive stronger ESG ratings under the chosen framework. Certain sectors and companies may achieve stronger ESG ratings because the rating methodology places greater emphasis on characteristics such as governance quality, disclosure practices, and direct carbon intensity.
At this stage, the portfolio’s reported sustainability profile improves.
Stage 2: Style Exposure Begins to Replace ESG Analysis
As higher-scoring companies enter the portfolio, a shift occurs. The portfolio may become increasingly exposed to common factors associated with highly rated companies: large market capitalisation, growth characteristics, and quality factors.
A portfolio can gradually become concentrated in the sectors and investment characteristics that score well under the chosen ESG framework. Over time, performance becomes increasingly influenced by those concentrations rather than by the sustainability objectives the mandate was intended to address.
Stage 3: The Hidden Concentration Emerges
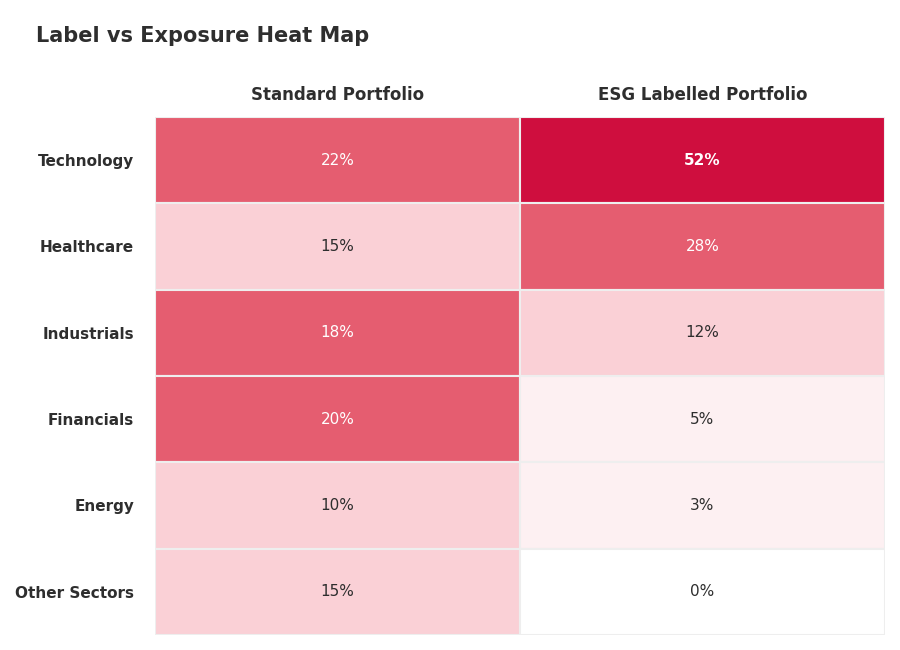
Label vs Exposure Heat Map
The aggregate ESG score remains healthy, but sector weights become increasingly skewed toward naturally high-scoring industries. Carbon-intensive sectors may be reduced, but other forms of concentration increase. Exposure becomes dependent on a narrower group of industries, business models, and valuation characteristics, thereby altering the risk profile of the portfolio
Traditional ESG dashboards rarely highlight this transition because the headline score continues to improve. The portfolio appears safe while the concentration is increasing.
Stage 4: Market Conditions Change
The weakness becomes visible when leadership changes within the market. Growth stocks fall out of favour, valuation multiples compress, and capital rotates into sectors previously underrepresented in the portfolio. The performance deteriorates.
At this point, the decline is often interpreted as an ESG problem. In reality, the portfolio is experiencing the consequences of a hidden style concentration that developed under the protection of a sustainability label.
The sustainability mandate did not fail, but the portfolio stopped behaving like a sustainability strategy and started behaving like a concentrated factor bet.
This is the central governance risk: mandate erosion occurs when managers optimise for ESG scores rather than the sustainability risks the mandate was intended to address.
Following reforms to the French SRI label, Banque de France researchers found that approximately 41% of non-labelled funds exhibited lower carbon intensity than labelled sustainable funds (Banque de France, 2026). The finding illustrates how sustainability labels can diverge from underlying exposures. A portfolio may satisfy the requirements of a sustainability framework while carrying greater environmental exposure than a portfolio without the label.
The Litigation Layer
A second risk develops alongside concentration. As regulators increasingly adopt principles of double materiality, investors are expected to understand not only how sustainability issues affect portfolio value but also how portfolio holdings affect society and the environment (ESMA, 2026).
This introduces a new category of exposure. Companies facing environmental controversies, labour disputes, human rights claims, or greenwashing allegations may create legal and reputational liabilities that remain largely invisible within aggregate ESG scores.
Recent research indicates that investors increasingly view climate litigation and sustainability-related legal actions as financially material risks rather than reputational concerns alone (Gostlow et al., 2026).
The result is a reporting paradox. The portfolio may appear sustainable according to the dashboard while simultaneously accumulating concentration risk, transition risk, and litigation risk beneath the surface.
Looking Beneath the Label
Identifying mandate erosion requires moving beyond headline ESG scores and examining the portfolio through several analytical layers.
1. ESG Score Decomposition
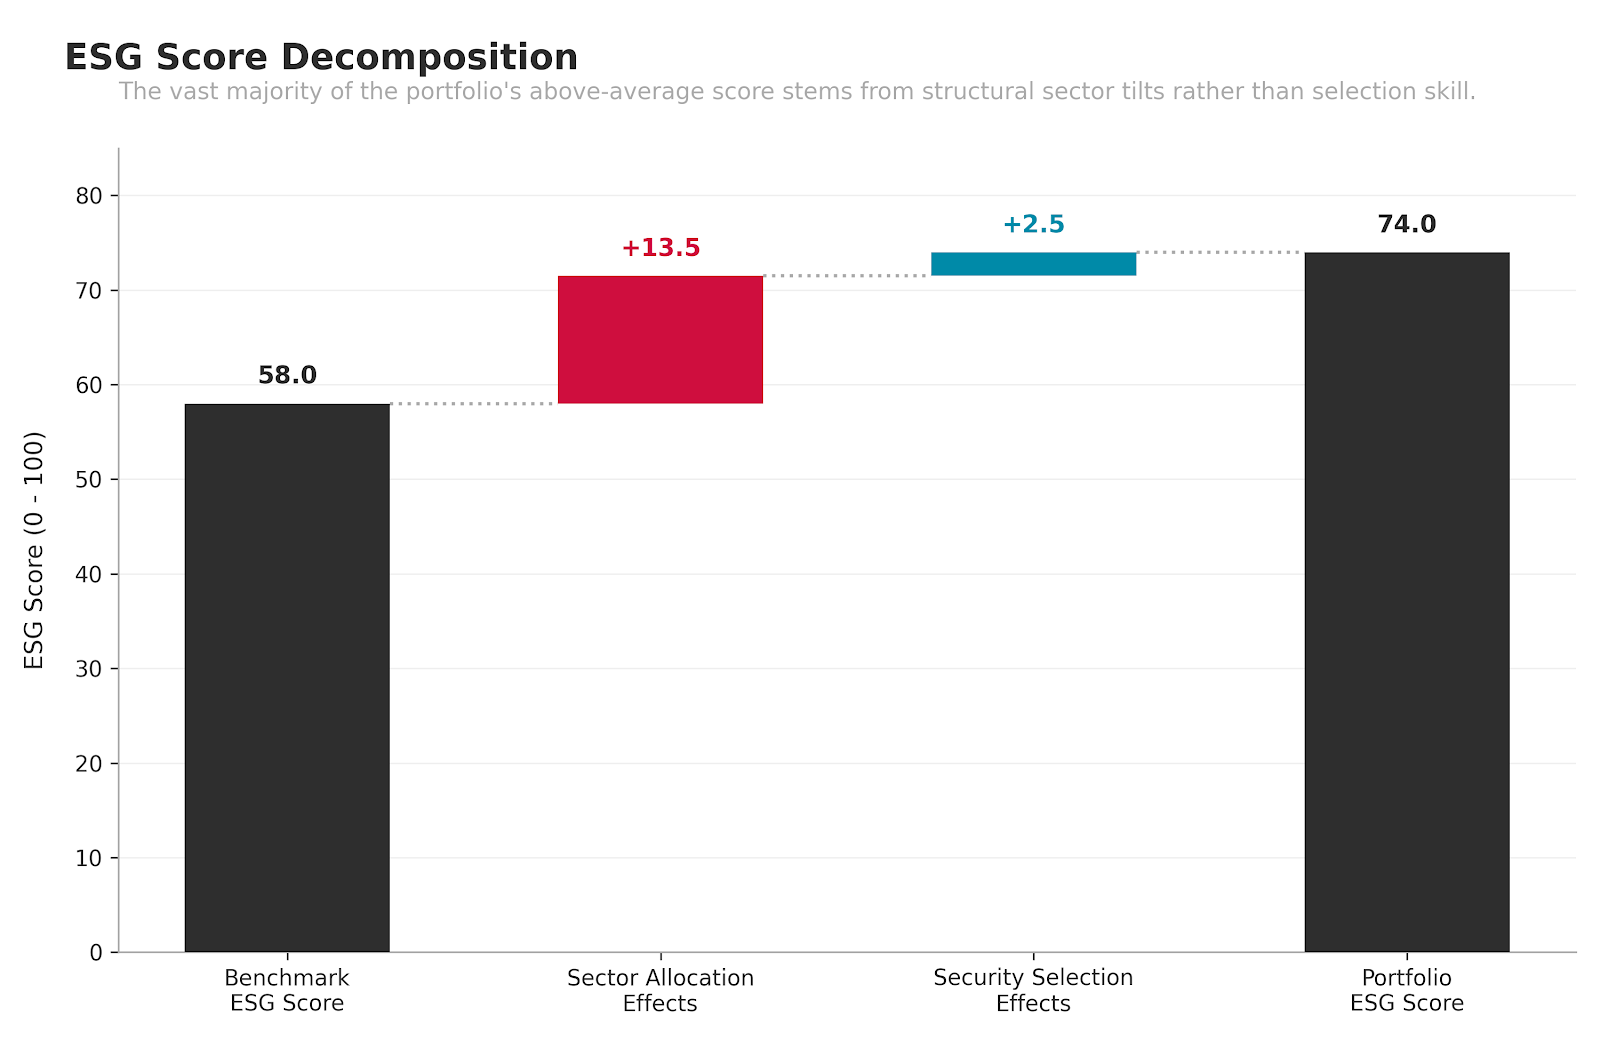
What’s Driving the ESG Score?
What it does
Decomposes the portfolio’s aggregate ESG score into the underlying sources contributing to that score, including sector allocation and security selection.
Required inputs
Portfolio holdings, position weights, ESG ratings, benchmark holdings, and benchmark ESG ratings.
What it reveals
Whether the portfolio’s ESG profile is primarily driven by active investment decisions or by structural characteristics such as sector allocation.
Why it matters
A manager should be accountable for investment decisions, not for benefiting from structural sector characteristics.
Subtleties & Limitations
- Methodology sensitivity: Results depend on the ESG provider used.
- Sector classification effects: Different classification systems can alter conclusions.
- Benchmark dependency: Findings vary depending on benchmark selection.
- Time-period distortion: Temporary sector rotations can affect results.
2. Weighted Average Carbon Intensity (WACI)
What it does
Measures portfolio exposure to carbon-intensive businesses based on emissions relative to revenue.
Required inputs
Portfolio holdings, emissions data, revenue data, and benchmark carbon intensity.
What it reveals
The portfolio’s actual exposure to transition risk, regardless of its ESG label.
Why it matters
Research shows that sustainable labels often provide weaker information about environmental exposure than direct carbon intensity measures (Banque de France, 2026).
Subtleties & Limitations
- Scope limitations: Many calculations rely heavily on Scope 1 and Scope 2 emissions.
- Data quality variance: Reporting quality differs significantly across regions.
- Sector effects: Some industries naturally carry higher emissions profiles.
- Backward-looking nature: Historical emissions may not reflect future transition plans.
3. Factor Exposure Analysis
What it does
Measures exposure to common investment factors such as Growth, Value, Quality, Momentum, and Size.
Required inputs
Portfolio holdings, historical returns, factor models, and benchmark exposures.
What it reveals
Whether the portfolio’s behaviour is being driven by sustainability analysis or by unintended style concentrations.
Why it matters
Some ESG portfolios may develop meaningful Growth or Quality exposures depending on how sustainability criteria are implemented.
Subtleties & Limitations
- Model selection: Different factor frameworks may produce different results.
- Overlap effects: ESG characteristics often overlap with recognised factors.
- Market regime sensitivity: Factor relationships change over time.
- Interpretation risk: Exposure alone does not imply poor portfolio construction.
4. Controversy Concentration Review
What it does
Identifies holdings with elevated governance, environmental, labour, legal, or regulatory controversies.
Required inputs
Holdings data, controversy ratings, litigation databases, and regulatory disclosures.
What it reveals
The portion of portfolio risk that may not yet be reflected in ESG scores.
Why it matters
Research increasingly identifies litigation and regulatory actions as material sustainability risks rather than secondary reputational concerns (Gostlow et al., 2026).
Subtleties & Limitations
- Reporting lag: Controversies often emerge before ratings adjust.
- Jurisdiction differences: Regulatory standards vary across regions.
- Severity assessment: Not all controversies carry equal financial consequences.
- Media bias: Public attention can influence coverage intensity.
5. Double Materiality Review
What it does
Evaluates both financial sustainability risks and the real-world impacts generated by portfolio holdings.
Required inputs
Holdings data, sustainability disclosures, emissions data, governance metrics, and impact indicators.
What it reveals
Whether the portfolio remains aligned with the broader sustainability objectives underlying the mandate.
Why it matters
Regulators increasingly expect sustainability claims to be supported by transparent methodologies, meaningful comparisons, and underlying evidence rather than headline scores alone (ESMA, 2025/2026).
Subtleties & Limitations
- Measurement complexity: Impact data remains less standardised than financial data.
- Comparability challenges: Cross-sector comparisons remain difficult.
- Evolving standards: Regulatory requirements continue to develop.
- Judgement dependency: Some assessments require qualitative interpretation.
Reclaiming Mandate Integrity
Detecting mandate erosion is only part of the challenge. Families, trustees, and advisors must also decide how sustainability objectives will be monitored, how deviations will be addressed, and what evidence will be required to demonstrate that the mandate remains intact.
Mandate Accountability Requires Evidence
A sustainability mandate is ultimately a governance instruction. If trustees and family councils cannot determine whether reported ESG outcomes result from genuine sustainability analysis or from portfolio positioning effects, accountability becomes impossible. Oversight shifts from verification to trust.
Concentration Risk Can Develop Behind Positive Narratives
High ESG scores often create a false sense of diversification. In practice, portfolios may become increasingly concentrated in particular sectors, factors, or company sizes while reporting metrics continue to improve. The governance challenge is not measuring sustainability performance. It is measuring what has been sacrificed to achieve it.
Information Asymmetry Widens Over Time
The longer a family relies on summary ESG metrics, the harder it becomes to identify whether the mandate remains intact. By the time performance, regulatory scrutiny, or litigation risk expose the problem, the underlying portfolio construction decisions may have been in place for years.
Steps to Take
- Separate Score from Source
Request attribution analysis showing how much of the portfolio’s ESG profile comes from sector allocation versus security selection. A score alone does not reveal how it was generated.
- Benchmark Carbon Intensity Directly
Compare portfolio carbon intensity against relevant benchmarks and peer portfolios. Focus on underlying exposure rather than sustainability labels.
- Review Factor Concentrations Quarterly
Require regular reporting of Growth, Value, Quality, and Size exposures. This helps identify whether ESG implementation is gradually becoming a disguised style allocation.
- Establish a Controversy Escalation Process
Define clear governance triggers for severe environmental, governance, labour, or litigation events affecting portfolio holdings. Escalation should occur before controversies affect portfolio performance.
- Assessthe Mandate Annually
Review whether current holdings remain consistent with the original sustainability objectives approved by the family. Mandates should be measured against their intended purpose, not merely against reported scores.
Independent Reporting
The value of reporting lies in reducing information asymmetry. The more important question is often whether the reported information accurately reflects the risks being taken.
A family office that receives only summary ESG metrics remains dependent on the manager’s interpretation of sustainability risk. A family office that receives independent analysis gains the ability to verify those interpretations, challenge assumptions, and detect mandate erosion before it becomes visible in performance results.
Finally, the ESG mandate should be assessed against the family’s broader sustainability strategy. Does the portfolio genuinely reflect the family’s sustainability objectives, or has the mandate become disconnected from what the family is trying to achieve?
Learn more about The Cecily Group’s independent reporting services: https://thececilygroup.com/financial-reporting/
Stay tuned as we continue unpacking our reporting methodology, and subscribe to our newsletter to follow the full Inside the Data series.
References:
Banque de France (2026) Reform of the SRI label: What is the impact on the carbon footprint of labelled funds? Paris: Banque de France. Available at: https://www.banque-france.fr/en/publications-and-statistics/publications/reform-sri-label-what-impact-carbon-footprint-labelled-funds.
European Securities and Markets Authority (ESMA) (2026) Thematic notes on clear, fair and not misleading sustainability-related claims. Paris: ESMA. Available at: https://www.esma.europa.eu/sites/default/files/2025-07/ESMA36-429234738_-154_Thematic_notes_on_clear__fair___not_misleading_sustainability-related_claims.pdf.
Gostlow, G., Byrne, J., Ranger, N. and collaborators (2026) Climate litigation as a financial risk: evidence from a global survey of equity investors. London: Grantham Research Institute on Climate Change and the Environment, London School of Economics and Political Science. Available at: https://ideas.repec.org/p/ehl/lserod/138056.html.
Task Force on Climate-related Financial Disclosures (TCFD) (2021) Recommendations of the Task Force on Climate-related Financial Disclosures. Basel: Financial Stability Board. Available at: https://assets.bbhub.io/company/sites/60/2021/10/FINAL-2017-TCFD-Report.pdf.
Visual: Vassily Kandinsky – Composition 8