Why “Compliant” Dashboards Fail Families and What to Do About It

Fernand Léger – The City
The Reporting Gap
Most financial reports are written by the very people managing your money. By their nature, they often highlight wins while concealing inefficiencies, leaving you with a fragmented and biased view of your true wealth. This “reporting gap” makes it nearly impossible to conduct advanced risk analysis or see the whole picture of your exposures.
At The Cecily Group, we take a different approach. Our independent reporting service consolidates data from all banks and asset managers, analysing every transaction with granular precision. We translate complex datasets into clear, executive-level insights that strengthen governance and support better decision-making. Our goal is to show you what your asset managers won’t.
With our Inside the Data series, we go one step further. Each article examines a commonly used reporting metric or practice, explaining where it provides clarity and where it can obscure underlying risks. By unpacking these blind spots, we aim to show how independent reporting, structured for insight, supports more informed and confident decision-making.
The Compliance Checkbox
For family office managers seeking high-level oversight, binary indicators are seductive. Committees often rely on a “Compliance” dashboard light: if it’s green, they move on; if it’s red, they accept a quick explanation like “market movements.” However, a simple Yes/No is a lazy metric because it hides the magnitude and duration of the breach.
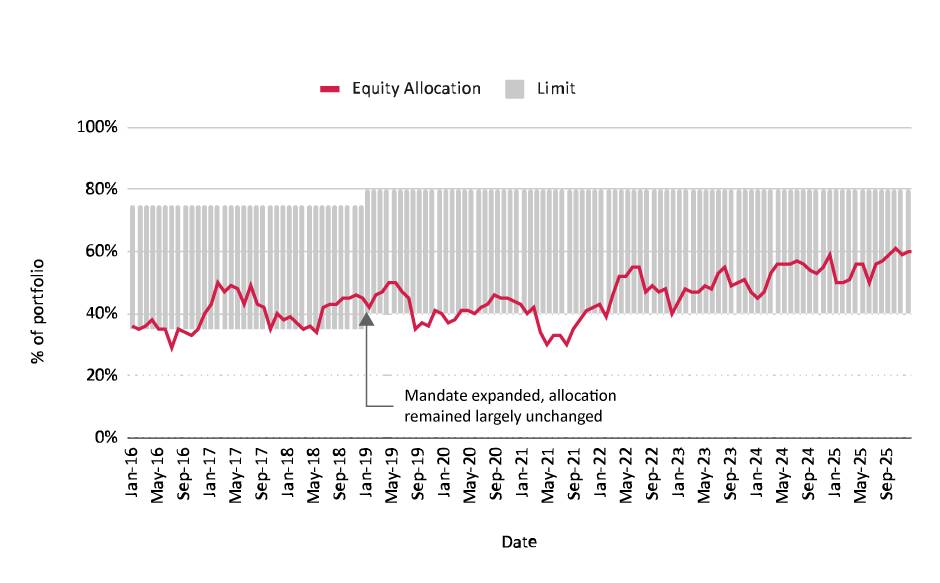
Asset Allocation Over Time Chart Example
As highlighted in our recent analysis of an executive report, one manager was technically “out of compliance” while holding 32% in Alternatives against a 15% limit, and only 27% in Fixed Income against a 40% minimum. This is not a rounding error. It represents a fundamental change in the portfolio’s identity — one that a checkbox report would completely mask.
The Manager’s Defence
When confronted with such significant deviations, managers typically deploy two defences.
“Letting Winners Run”
They argue that selling appreciated private credit or real estate positions would trigger unnecessary capital gains taxes and transaction costs. They prioritise tax efficiency over strategic risk control.
“Protecting Capital”
They claim that the Investment Policy Statement was set in a different interest rate environment. They argue that strictly adhering to fixed-income minimums would force them to buy “losing assets,” essentially asserting that their tactical view supersedes your family’s governance policy.
Research suggests these defences are often flawed. Ibert (2025) notes that while tactical shifts happen when a growth outlook deteriorates, the actual demand sensitivities of large managers are often economically small — meaning they should typically stay closer to their benchmarks than many claim. Furthermore, Zhu (2015) indicates that most currently used allocation strategies are far from ex-post optimal, suggesting that “sophisticated” tactical deviations rarely outperform simpler rebalancing rules over time.
If the defences are weak, then what is actually happening inside the portfolio?
How Drift Works
When a portfolio outperforms its benchmark, the instinctive response is to congratulate the manager. The numbers look good, the quarterly report reads well, and the temptation is to leave well enough alone. But outperformance always demands a second question: where did it come from?
The relative outperformance of one asset class means that it will, over time, represent a larger share of the total allocation. Asset managers should conduct regular rebalancing — selling outperforming asset classes to restore target weights. This is not consistently done. The result is a drift where temporarily outperforming asset classes take on a larger and larger proportion of the portfolio’s assets.
As long as these asset classes continue to outperform, everything looks good subjectively. Objectively, risks accrue beneath the surface. The outperformance becomes more pronounced against the benchmark, which usually has a fixed allocation. When these outperforming asset classes eventually turn — through reversion to the mean or a shift in market regime — the portfolio experiences a sudden and disproportionate downward pull.
What looked like skill was actually an unauthorised increase in risk. The gains were not alpha — the residual return attributable to genuine investment skill. They were beta drift: compensation for risks the client never agreed to bear.
The Liquidity Dimension
The true danger of allowing an Alternatives allocation to swell — from 15% to 32%, for example — is liquidity mismatch. Managers often drift into illiquid assets like private equity or private credit to chase yield when liquid assets are underperforming. Because these assets do not trade daily, they do not mark-to-market as visibly as public securities, allowing the allocation to balloon quietly.
When a family eventually needs cash for an emergency or tax bill, they find they cannot exit these positions without taking a massive discount. Assets that do not mark-to-market become less pegged to a benchmark, as their valuations may lag by several months. A small but important technical point: new valuations arriving from past months do not affect the current reporting period — they result in a restatement of past performance.
In 2019, the Woodford Equity Income Fund collapsed because manager Neil Woodford drifted from liquid large-cap stocks into illiquid, unquoted small-cap companies to boost performance. When investors tried to redeem their capital, the fund could not sell the illiquid assets fast enough, leading to permanent losses. The Woodford case remains the defining cautionary tale of liquidity mismatch in modern portfolio management.
How to See What the Dashboard Hides
Simple performance reporting cannot detect drift. More sophisticated tools are required, deployed in layers — each serving a distinct purpose in the governance infrastructure.
Layer 1: Tracking Error Analysis as a Smoke Alarm
Tracking error analysis serves as the early warning system that sits above the other techniques. It measures how far a portfolio’s returns are deviating from its benchmark over time, expressed as the standard deviation of the return difference. Most mandates specify a tracking error limit — say, 2% — within which the manager is expected to operate.
By monitoring this figure on a rolling basis, an oversight body can detect drift before it becomes a problem: a tracking error that creeps from 1.7% to 2.1% to 2.8% over successive quarters signals that the portfolio is diverging from its benchmark in ways that compound. The strength of tracking error as a governance tool is its simplicity and immediacy — it does not tell you what is drifting or why, but it tells you that something is, and that further investigation is warranted. It functions as the smoke alarm: once it triggers, you deploy the more sophisticated tools to identify the source.
Layer 2: Returns-Based Style Analysis
Returns-Based Style Analysis, developed by Nobel laureate William Sharpe, is a statistical technique that reverse-engineers a portfolio’s true asset class exposures from its return pattern alone. Rather than examining individual holdings, it takes the portfolio’s monthly return series and asks: which combination of benchmark indices — say, global equities and global bonds — would most closely replicate this pattern of returns?
By running this analysis on a rolling basis, an oversight body can watch how the implied allocation shifts over time. A portfolio mandated as 60% equity and 40% bonds might, eighteen months later, exhibit a return pattern consistent with 75% equity and 25% bonds — revealing drift that a simple performance report would never surface. The technique is particularly valuable in governance contexts because it requires nothing more than a return stream; even where a manager provides limited transparency into underlying holdings, RBSA can detect whether the portfolio is behaving in line with its mandate.
Layer 3: Factor Decomposition
Factor decomposition takes the analysis a step further by asking not just what the portfolio is exposed to, but whether the manager’s claimed outperformance survives scrutiny. The technique breaks a portfolio’s returns down into exposures to well-documented systematic factors — market beta, company size, value, momentum, credit quality, and others — and isolates whatever residual return remains once those exposures are accounted for. That residual is true alpha: the portion of performance attributable to genuine skill rather than systematic risk-taking.
In practice, the results can be sobering. A manager reporting 3% annualised outperformance might, under factor decomposition, turn out to have been persistently overweight in small-cap momentum stocks. Once those factor tilts are priced in, the apparent alpha shrinks to a fraction of a percent — statistically indistinguishable from zero. What was presented as superior stock selection was, in reality, an unacknowledged bet on factors the client never explicitly approved. For families and their advisors, this is a critical governance tool: it separates the narrative of skill from the reality of risk.
While factor decomposition is most commonly associated with equity portfolios, it is equally — and arguably more — important in fixed income. Here, the systematic factors include duration, credit quality, term structure positioning, and liquidity. A bond manager reporting steady outperformance may simply be running longer duration or quietly migrating down the credit spectrum into lower-rated instruments, earning a spread premium that masquerades as skill. This type of drift is particularly insidious in fixed income because it remains invisible in normal market conditions; the additional risk only reveals itself during periods of stress, when credit spreads widen and illiquid positions cannot be exited. By the time the drift becomes apparent in raw performance numbers, the damage is already done.
Layer 4: Holdings-Based Attribution
Holdings-based attribution offers the most granular view of the four techniques, but requires direct transparency into the portfolio’s underlying positions. Where returns-based style analysis and factor decomposition work backwards from performance data, holdings-based attribution works forward from actual positions, comparing quarterly or monthly snapshots of the portfolio against the policy allocation to track how individual weights evolve over time.
Crucially, it can distinguish between passive drift and active decision-making. If an emerging market allocation grows from 10 to 15% of a portfolio, holdings-based attribution can decompose that change into a return effect — the mechanical consequence of emerging markets outperforming other asset classes — and an allocation effect — the manager actively purchasing additional emerging market exposure on top of the passive drift. The former is a rebalancing failure; the latter is a deliberate, and potentially unauthorised, concentration bet. This distinction matters enormously from a governance perspective, because the two causes demand very different responses: one calls for a disciplined rebalancing schedule, the other for a serious conversation about mandate compliance.
What Even Sophisticated Tools Can Miss
Even the tools described above can mislead without expert interpretation. There are several subtleties that an experienced analyst watches for — each representing a way in which standard metrics can paint a rosier picture than reality warrants.
Benchmark Gaming
A sophisticated manager knows exactly which benchmark they are measured against and can construct a portfolio that technically stays within tracking error limits while taking substantial hidden risks. For instance, they might match sector weights precisely but take concentrated single-name bets within each sector. The tracking error looks tidy, but the idiosyncratic risk is enormous. An analyst needs to examine tracking error and concentration metrics together.
The Liquidity Illusion
Some strategies generate apparently smooth, consistent returns by holding illiquid assets that are marked to model rather than marked to market. Private credit, structured products, and certain real estate vehicles can show low volatility and low tracking error simply because they are not being repriced frequently. The risk has not disappeared; it has been hidden by the valuation methodology. An analyst must distinguish between genuinely low-risk strategies and strategies where the risk is latent and will crystallise during a liquidity event.
Fee-adjusted analysis
A surprisingly common oversight. A manager showing 50 basis points of alpha before fees but charging 75 basis points is actually delivering negative alpha net of costs. The analyst must always evaluate performance after all fees, including performance fees, which can be structured in ways that asymmetrically favour the manager — they capture a share of the upside but do not rebate on the downside.
Multi-manager Interaction Effects
When a family employs multiple managers, each individual mandate might be within bounds, but the aggregate portfolio can drift substantially. If three out of five managers all independently drift toward the same factor exposure — say, overweighting US technology — the total portfolio has a massive concentration that no single mandate report would reveal. The analyst must monitor at the aggregate level, not just manager by manager.
Style Drift Disguised as Evolution
Managers will sometimes argue that drift is an intentional adaptation to changing market conditions rather than a mandate violation. “We reduced duration because we anticipated rate rises” sounds like skill. But if the mandate did not authorise tactical duration bets, it is still a breach regardless of whether it worked. The analyst must distinguish between permitted tactical flexibility and unauthorised mandate deviation — and that distinction lives in the investment management agreement, not in the performance report.
From Diagnosis to Action
If a breach of this magnitude persists without remediation, it implies several critical issues.
Governance Decay
Your Investment Policy Statement is effectively void. The governance committee has implicitly engaged in “Strategy Creep” — a gradual, undocumented departure from the agreed investment mandate — without a formal decision.
Fee Misalignment
You may be paying high active management fees for a mandate that has drifted away from its original purpose. If a manager is charging for active fixed income management but effectively running a passive ETF strategy, the fee structure is no longer appropriate. Active management of direct equity and fixed income positions is significantly more laborious than passive index replication — and the fees should reflect the work actually being done.
Intergenerational Risk
For family trusts, allocation bandwidths are set to ensure sufficient liquidity for beneficiary distributions. Doubling illiquid exposure means the portfolio may fail to meet a sudden call for capital without fire-selling other assets. This is precisely why independent oversight of the portfolio’s liquidity profile matters: the responsibility for liquidity planning rests with the family or trustee, and they cannot plan effectively without accurate, unbiased data on the portfolio’s true liquidity position.
Steps to Take
To regain control of your portfolio’s risk profile, take the following steps.
-
Request a Liquidity Ladder
Ask your manager to map the Alternatives allocation by specific redemption terms: daily, monthly, quarterly, one-year lock-up, and beyond. This single exercise will reveal how much of your portfolio is genuinely accessible in a crisis.
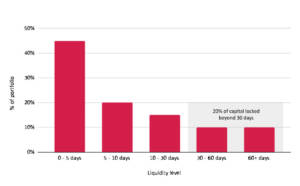
Time to Liquidity of Portfolio Holdings Chart Example
-
Define a Hard Remediation Date
Do not accept “we are watching it” as a response. Set a specific date — for example, “by the end of Q4” — for the portfolio to return to compliance with the IPS. Document the commitment in writing.
-
Audit the IPS
If the manager’s tactical view is indeed valid, convene your investment committee to formally update the Investment Policy Statement. A deliberate, documented change in strategy is governance. An undocumented drift is not. Do not leave your wealth in a state of permanent breach.
-
Implement an Escalation Trigger
Establish a hard stop rule: any breach lasting longer than two quarters requires a formal written explanation to the Family Council or Trustees. This creates accountability and ensures that drift cannot persist through inertia.
The Reporting Premium
The common thread connecting every section of this analysis is information asymmetry. The asset manager knows more about the portfolio’s true risk profile than the client does, and standard reporting — often produced by the manager themselves — perpetuates that asymmetry rather than closing it.
Independent, high-quality reporting creates what we call a “reporting premium.” It does not generate returns directly, but it protects against the silent erosion of returns through unmonitored drift, fee leakage, and governance decay. It allows families to distinguish between a manager who is genuinely adding value and one whose outperformance is borrowed from risks that will eventually come due.
In an industry where the information advantage overwhelmingly favours the asset manager, independent oversight is not a luxury. It is the minimum standard of fiduciary care.
If your portfolio lacks this layer of independent scrutiny, it may be time to ask what your current reporting is not telling you.
Book a walkthrough or request a demo report to find out.
Disclaimer: This content is provided for informational purposes only and does not constitute investment advice. It is intended to support informed discussion and should not replace individual judgment or professional guidance.
References
Cremers, K. J. M. and Petajisto, A. (2009) ‘How Active Is Your Fund Manager? A New Measure That Predicts Performance,’ Review of Financial Studies, 22(9), pp. 3329–3365. Available at https://doi.org/10.1093/rfs/hhp057
Ibert, M. (2025) ‘Tactical Asset Allocations of Large Asset Managers,’ Copenhagen Business School & Danish Finance Institute Working Paper, November. Available at SSRN: http://dx.doi.org/10.2139/ssrn.5685962
Sharpe, W. F. (1992) ‘Asset Allocation: Management Style and Performance Measurement,’ Journal of Portfolio Management, 18(2), pp. 7–19. Available at: https://www.martinsewell.com/edge-fund/Shar92.pdf
Zhu, L. L. (2015) ‘The Performance of Asset Allocation Strategies Across Datasets and Over Time,’ University of Edinburgh Business School Working Paper, August. Available at: http://dx.doi.org/10.2139/ssrn.2650695