
A portfolio may report a 12% equity return against an 8% target, appearing to have delivered a strong result. Yet sector attribution can reveal that the majority of that return came from a single overweight sector, while the rest of the portfolio contributed little or lagged.
This introduces a governance contradiction: the headline result looks successful, but the source of return may be concentrated, fragile, and outside the family’s intended risk appetite.
Standard manager reporting often fails to reveal this because it focuses on total equity return. This figure answers how much the portfolio made, but not the more important governance question of how that return was generated.
A strong total return can obscure the difference between a diversified investment process and a concentrated sector bet that happened to work. A manager may appear successful because the portfolio gained 10% or 12%, but without sector attribution, trustees may not fully see whether the return came from broad stock selection, disciplined allocation, or one dominant exposure.
This matters because strong performance can reduce scrutiny. When returns are positive, oversight committees may stop asking whether the portfolio remains balanced, whether sector exposures are intentional, or whether a manager has drifted away from the mandate’s original purpose.
Most reports are created by the same institutions managing the assets, which can leave families with numbers but limited insight into underlying risk, costs, and exposures. Independent reporting consolidates data across managers and portfolios, turning fragmented performance figures into a clearer basis for oversight and accountability.
Why Strong Returns Can Conceal Weak Diversification
Managers rarely dispute the numbers. The defence focuses on interpretation.
“We don’t pick sectors; we pick great companies.”
The manager argues that stock selection matters more than sector allocation. Strong businesses, in this view, justify concentrated exposure.
This defence ignores correlation risk. Companies within the same sector are often exposed to the same underlying forces: interest rates, regulation, supply chains, or capital availability. A portfolio holding ten “great” technology companies may still represent a single macroeconomic bet. Research on sector concentration shows that active managers often cluster into the same industries when pursuing similar characteristics such as growth or quality (Kacperczyk, Sialm & Zheng, 2005).
“The benchmark is backwards-looking.”
The manager argues that sector overweights reflect forward-looking conviction rather than passive benchmark thinking.
Benchmarks are not predictions. They represent the available opportunity set and the agreed reference point for measuring active decisions. Deviating from them may be justified, but the risk taken must be evaluated relative to the diversification profile the family originally approved. Without this discipline, “conviction” becomes difficult to distinguish from unmanaged concentration.
“Performance proves the strategy works.”
The manager points to strong headline returns as evidence that the positioning was correct.
This confuses outcome with process. A concentrated exposure can generate exceptional returns during favourable market conditions while still introducing structural fragility into the portfolio. Behavioural finance research shows that investors often reinforce successful decisions without fully reassessing the risks that produced them, particularly after periods of strong performance (Kahneman & Tversky, 1979).
Each defence treats performance as proof of diversification discipline rather than evidence to be examined more closely.
If strong returns can conceal increasing concentration, how does sector risk accumulate without appearing explicitly in the reporting process?
How Sector Concentration Builds Beneath Strong Returns
The distortion begins with the difference between performance measurement and source analysis.
Total return measures the final outcome. Sector attribution measures where that outcome came from. The first can indicate success. The second reveals how dependent that success was on a small number of exposures.
This creates the condition for false diversification: strong portfolio performance can conceal that return generation has become increasingly dependent on concentrated sector exposure rather than a balanced investment process.
The process typically develops in four stages.
1. A manager develops a preferred factor profile
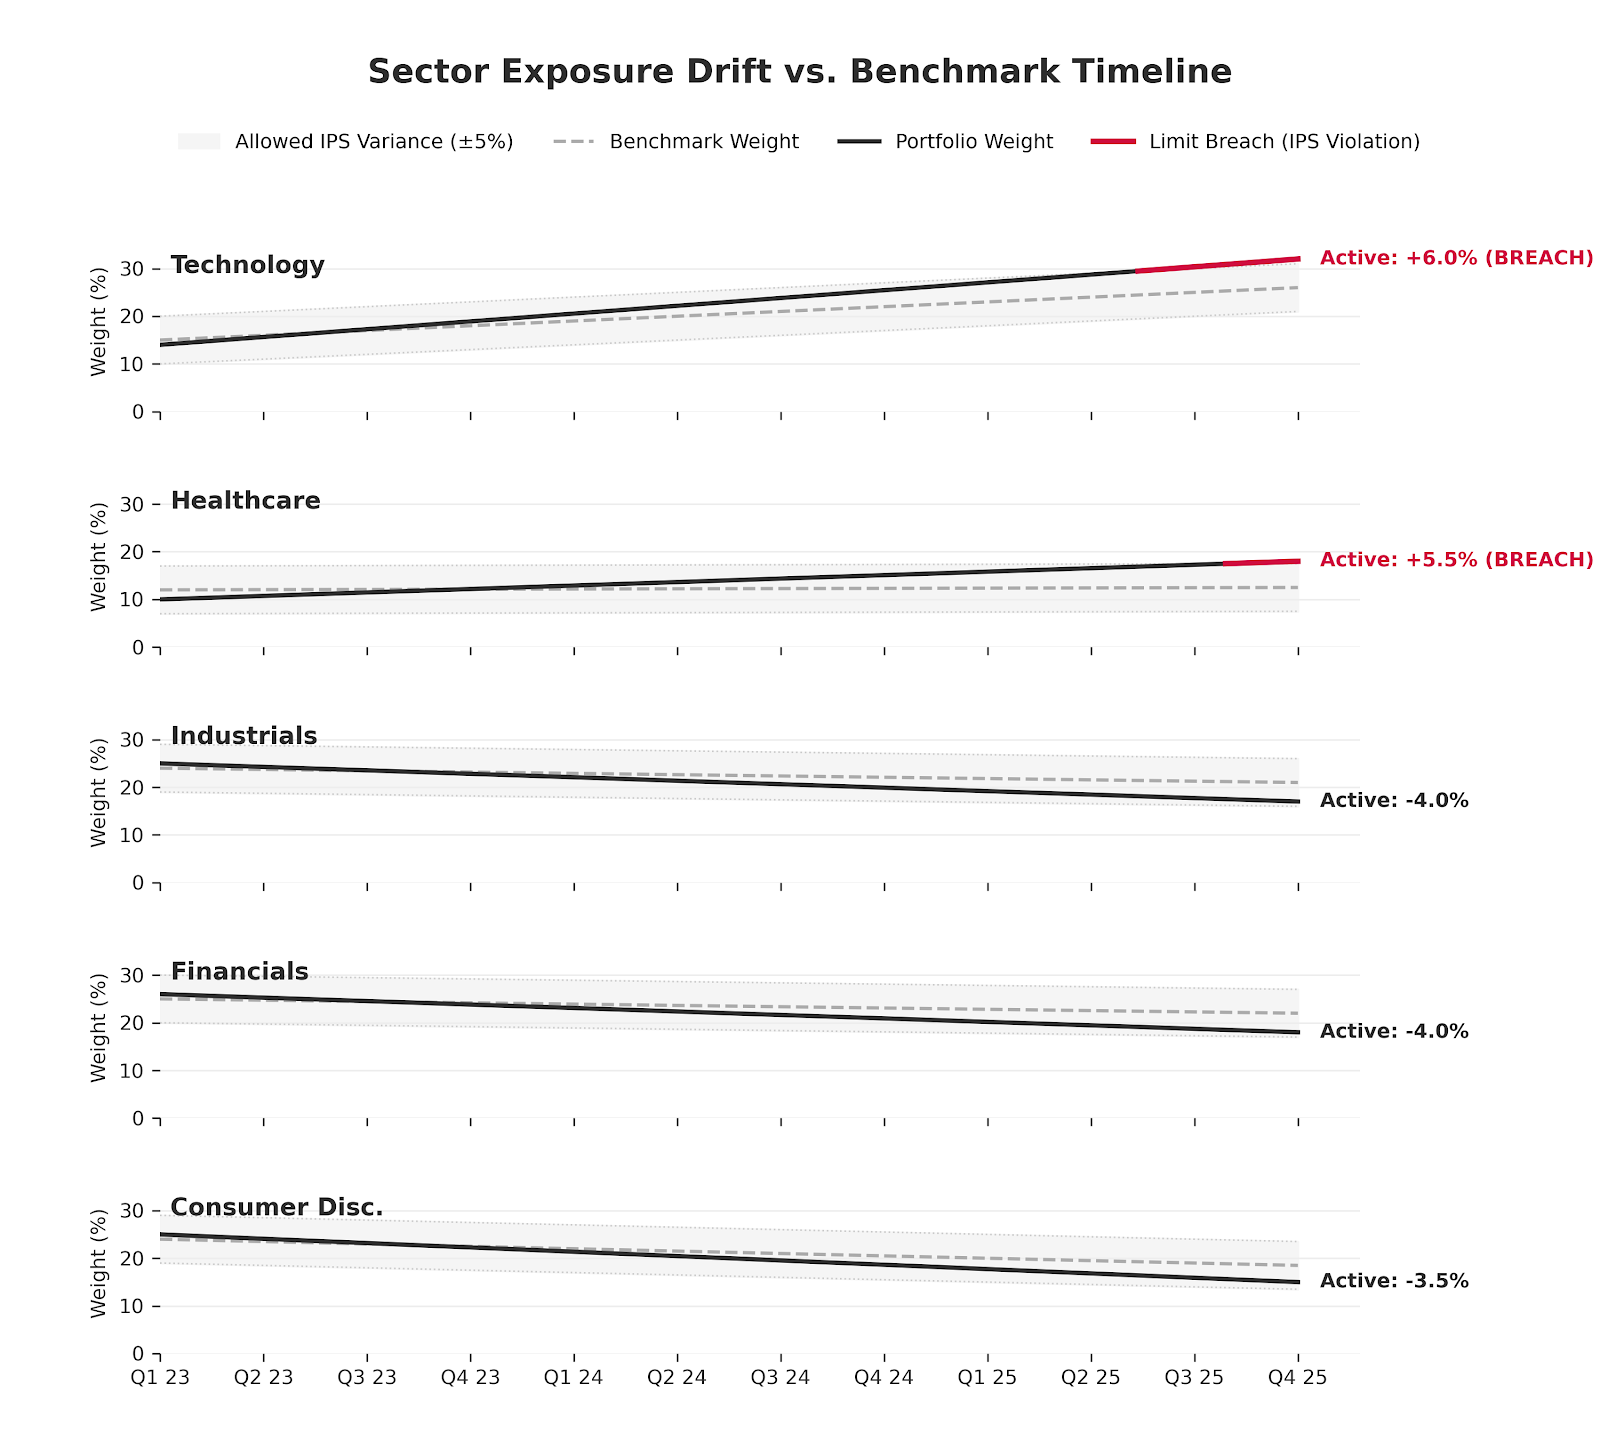
Sector Exposure Drift vs. Benchmark Timeline
Managers often search for similar characteristics across multiple companies: high growth, low volatility, pricing power, or strong balance sheets.
This appears diversified at the security level because the portfolio may contain dozens of individual holdings. In practice, however, these characteristics frequently cluster within the same sectors. A portfolio seeking “quality growth” may gradually accumulate large Technology and Healthcare exposures without explicitly intending to make sector bets.
2. Performance reinforces concentration
When a concentrated sector performs well, it begins contributing a disproportionate share of total portfolio return.
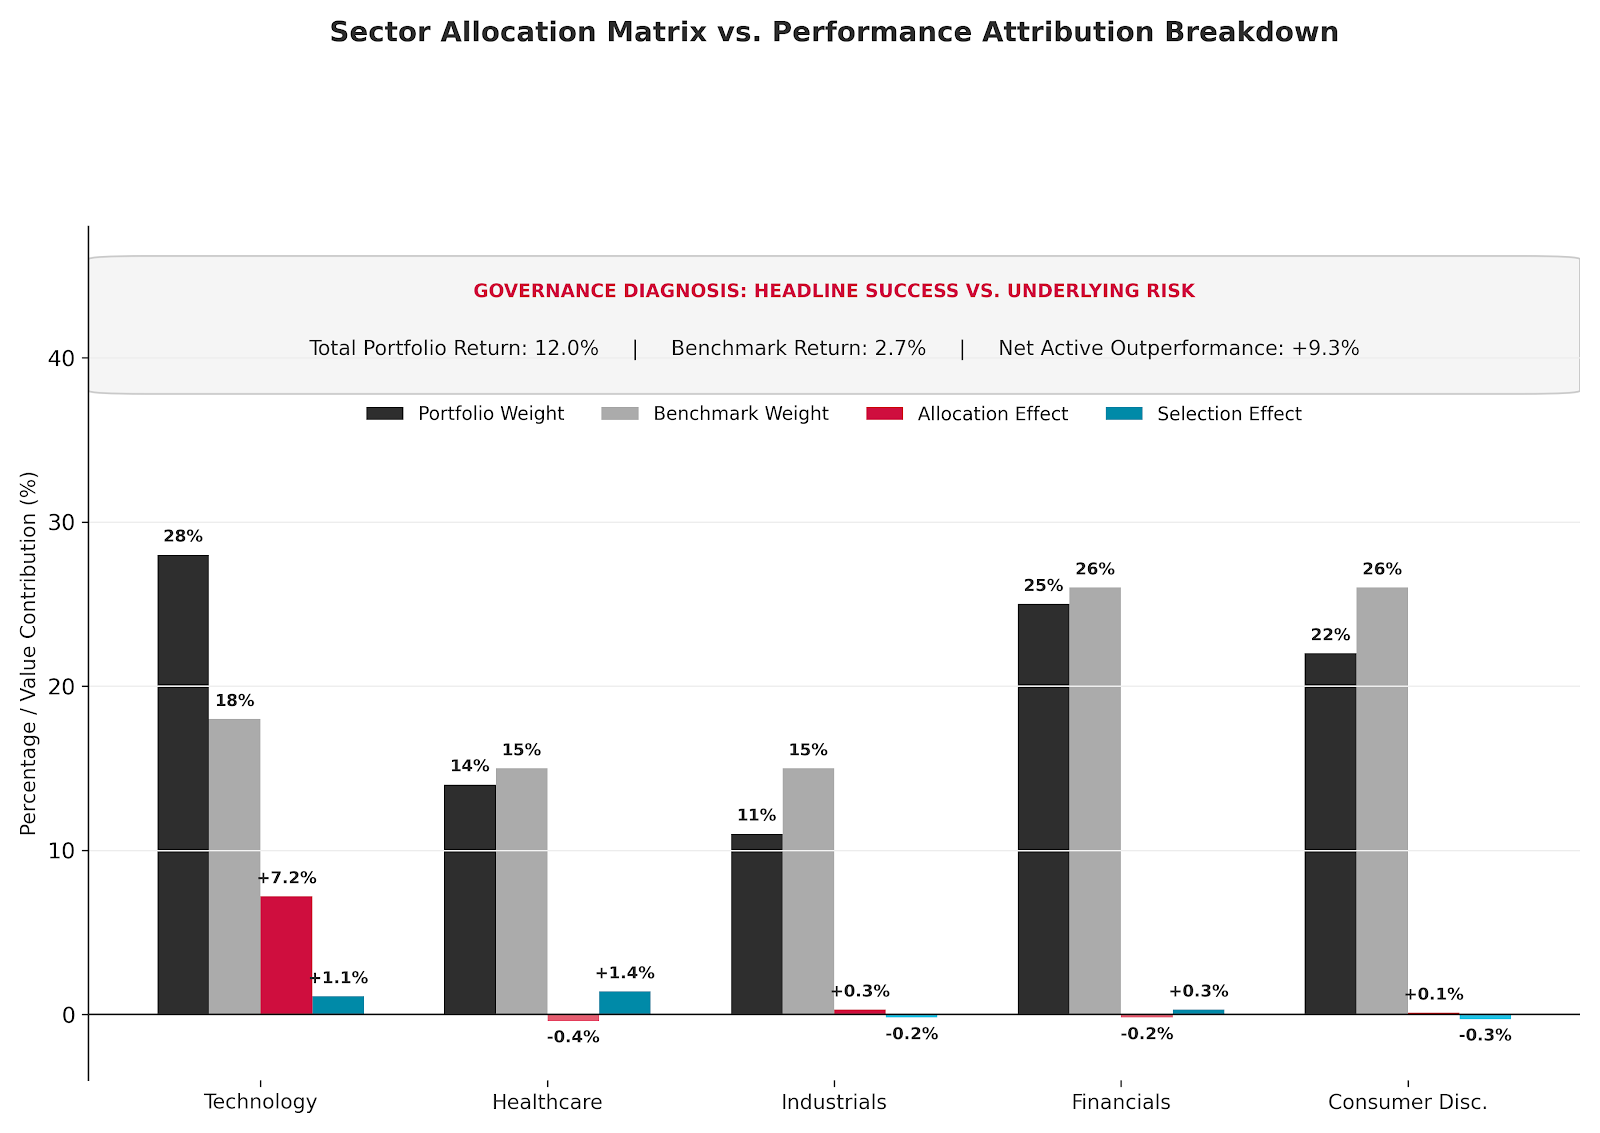
Attribution analysis separates this into:
- Allocation effect — value added by overweighting a sector
- Selection effect — value added by choosing better securities within that sector
Without attribution reporting, these two effects become blurred. Strong returns may be interpreted as evidence of stock-picking skill when they were primarily driven by sector positioning. Brinson, Hood and Beebower (1986) demonstrated that allocation decisions are a major driver of portfolio return variability over time.
3. Correlation risk remains hidden during favourable markets
As long as the dominant sector continues performing, the concentration may appear justified.
The problem emerges because stocks exposed to the same economic drivers often move together under stress. What appears diversified by company count may still represent a single underlying exposure to interest rates, liquidity conditions, or regulatory policy.
This is particularly dangerous in family office structures where multiple managers independently crowd into the same sectors through similar “quality” or “growth” frameworks.
4. The underlying dependency often becomes visible only during reversal
Sector concentration often remains hidden until market leadership changes.
During the 2022 energy rally, many equity portfolios outperformed benchmarks primarily because of large overweight positions in Energy producers. As oil and gas prices surged during the global energy crisis, these portfolios appeared highly successful on a headline return basis. Attribution analysis later showed that much of the excess return came from concentrated sector exposure rather than diversified stock selection (International Energy Agency, 2022; Kacperczyk, Sialm & Zheng, 2005).
The Hidden Layer: Crowding Risk
The mechanism becomes more severe when multiple managers pursue similar positioning simultaneously.
Research on industry concentration in actively managed funds shows that managers often crowd into the same sectors while seeking similar performance characteristics (Kacperczyk, Sialm & Zheng, 2005). This creates a structural vulnerability: liquidity appears sufficient during rising markets, but weakens sharply during reversal periods when many investors attempt to exit the same trades at once.
At this stage, the issue is no longer individual manager concentration. It becomes a system-level governance problem affecting diversification, liquidity resilience, and capital preservation across the entire family portfolio.
How to Detect Concentration Before It Dominates the Portfolio
Strong returns can delay scrutiny. Detecting concentration risk requires analysis that separates performance outcome from the structure that produced it.
1. Sector Allocation vs Return Contribution Matrix
What it does:
Compares sector weights with the percentage contribution each sector makes to total portfolio return.
Required inputs:
Sector-level portfolio weights, benchmark weights, and sector return contribution data.
What it reveals:
Whether portfolio performance is broadly distributed or dominated by a small number of sector exposures.
Why it matters:
A sector contributing a disproportionate share of return may indicate hidden concentration risk rather than diversified alpha generation.
Subtleties & Limitations:
- Strong contribution does not automatically imply excessive risk
- Sector definitions depend on the GICS classification framework
- Temporary concentration may reflect tactical positioning rather than structural drift
2. Allocation vs Selection Attribution Analysis
What it does:
Separates performance generated from sector overweighting (allocation effect) from performance generated through stock selection (selection effect).
Required inputs:
Portfolio holdings, benchmark sector weights, and security-level return data.
What it reveals:
Whether the manager added value by choosing stronger securities or by making directional sector bets.
Why it matters:
It distinguishes investment skill from favourable market positioning.
Subtleties & Limitations:
- Attribution models vary across providers
- Results depend heavily on benchmark construction
- Short measurement periods can distort attribution effects
3. Active Share by Sector
What it does:
Measures how different the portfolio’s sector exposures are from the benchmark.
Required inputs:
Portfolio sector weights and benchmark sector weights.
What it reveals:
Whether the manager is making meaningful active sector decisions or closely replicating the benchmark.
Why it matters:
High active share may indicate genuine conviction, but also increases concentration and tracking risk. Low active share may suggest “closet indexing” despite active management fees (Cremers & Petajisto, 2009).
Subtleties & Limitations:
- High active share is not inherently positive
- Different active positions can still share similar factor exposure
- Does not measure stock-selection quality directly
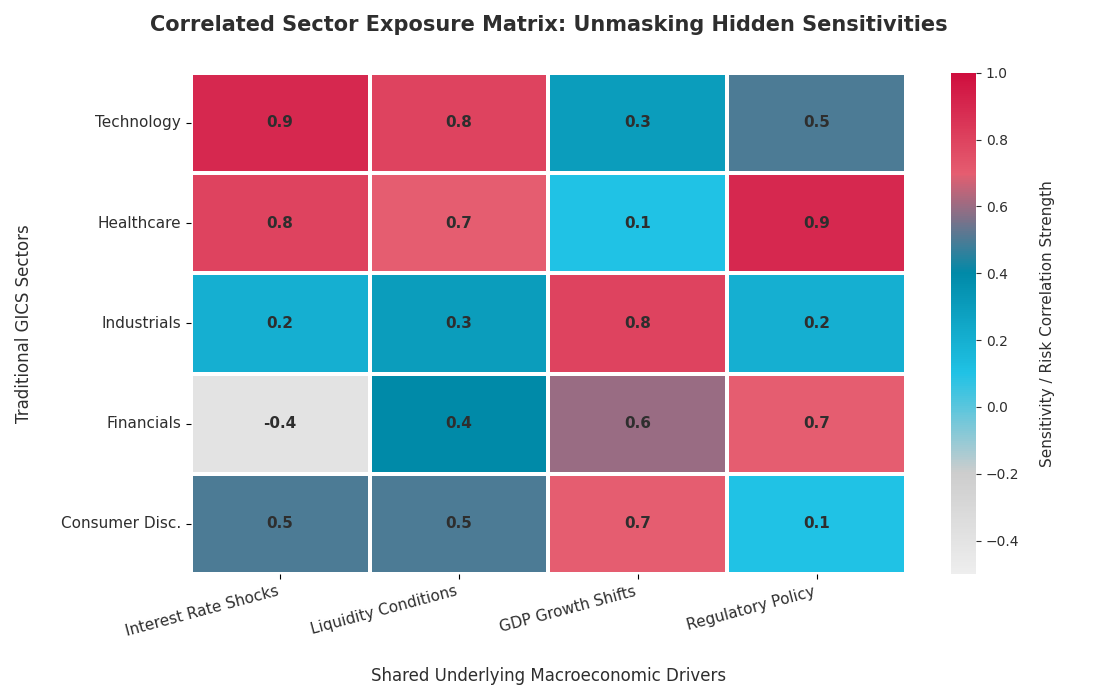
4. Correlated Sector Exposure Mapping
What it does:
Groups sectors according to shared economic sensitivities rather than formal classification labels.
Required inputs:
Sector exposure data, factor sensitivity analysis, and correlation history.
What it reveals:
Whether apparently different sectors are exposed to the same macroeconomic drivers.
Why it matters:
Technology and Communication Services, for example, may behave similarly during interest rate shocks despite appearing diversified in standard reports.
Subtleties & Limitations:
- Correlations change across market cycles
- Historical relationships may break down during crises
- Requires more advanced analytical infrastructure
From Diagnosis to Governance Action
Once identified, concentrated return generation carries direct implications for manager oversight, diversification discipline, and long-term capital preservation.
Strong performance can weaken governance discipline
Positive returns often reduce scrutiny precisely when concentration risk is increasing. Families may focus on outcome satisfaction rather than examining how the return was produced.
Sector concentration can undermine diversification without appearing obvious
Portfolios may appear diversified by holding count while remaining highly dependent on a small number of economic drivers.
Mandate consistency becomes harder to assess without attribution analysis
A manager can remain formally within mandate guidelines while gradually transforming the portfolio into a concentrated thematic exposure.
Steps to Take
- Review the Largest Sector Contributors
Require managers to identify which sectors contributed most to portfolio return and explain whether the contribution resulted from allocation or selection decisions. - Monitor Sector Weights Relative to Benchmark
Track persistent overweights and underweights rather than reviewing only total portfolio return. - Set Explicit Sector Concentration Limits
Define acceptable sector deviation ranges within the Investment Policy Statement (IPS), with escalation triggers for persistent breaches. - Compare Public and Private Sector Exposure Together
Combine public equity, private equity, and operating business exposure to understand total family sector concentration. - Trigger Reviews After Concentrated Return Periods
If one sector contributes a disproportionate share of portfolio return across multiple quarters, initiate a mandate consistency review.
Independent Reporting
Independent reporting can reveal the mechanism behind returns. It reduces information asymmetry between asset owners and managers by aligning portfolio behaviour with the family’s governance framework and investment objectives.
See how independent reporting can strengthen your oversight:
https://thececilygroup.com/financial-reporting/
Stay tuned as we continue unpacking our reporting methodology, and subscribe to our newsletter to follow the full Inside the Data series.
Image: Juan Gris – Still life and urban landscape (Place Ravignan)
References:
Brinson, G.P., Hood, L.R. and Beebower, G.L. (1986) ‘Determinants of portfolio performance’, Financial Analysts Journal, 42(4), pp. 39–44. Available at: https://pfa.kz/images/download/100331-brinson_Determinants_Portfolio_Performance.pdf
Cremers, M. and Petajisto, A. (2009) ‘How active is your fund manager? A new measure that predicts performance’, The Review of Financial Studies, 22(9), pp. 3329–3365. Available at: https://doi.org/10.1093/rfs/hhp057
Kacperczyk, M., Sialm, C. and Zheng, L. (2005) ‘On the industry concentration of actively managed equity mutual funds’, The Journal of Finance, 60(4), pp. 1983–2011. Available at: https://doi.org/10.1111/j.1540-6261.2005.00785.x
International Energy Agency (IEA) (2022) The 2022 energy crisis and global response. Available at: https://www.iea.org/topics/2022-energy-crisis.
Kahneman, D. and Tversky, A. (1979) ‘Prospect theory: An analysis of decision under risk’, Econometrica, 47(2), pp. 263–292. Available at: https://doi.org/10.2307/1914185