
Juan Gris – The Sunblind
In one of our client reports, a Monte Carlo analysis showed that several equity positions had less than a 10% probability of recovering their book value within 60 days. At the same time, the report presented these positions within a diversified portfolio context, implying controlled risk.
Positions with a statistically negligible chance of recovery remain held without escalation. The probability is visible, yet its implications are not acted upon. Behavioural biases—such as loss aversion and anchoring—reinforce this inertia, making it easier to tolerate weak positions than to realise losses and reallocate capital.
This gap arises because the metric is framed around book value — the original purchase price of the asset. In this context, the model measures the likelihood of recovering past losses while ignoring forward return potential.
A similar limitation appears in common reporting conventions such as year-on-year performance, which is anchored to an arbitrary 31 December cut-off, rather than reflecting the full economic reality of the investment. Both approaches prioritise reference points that are convenient for reporting, but not necessarily meaningful for decision-making.
In standard manager reporting, probabilistic outputs, if at all, are presented alongside performance and commentary, but without clarifying how they should influence decisions. As a result, the metric appears analytical while functioning as a passive observation. The metric is very often a summary of a portfolio or an asset class and thereby does not reveal individual risks within the portfolio.
The probability of exceeding book value reduces a range of outcomes to a single threshold and shifts attention away from the underlying distribution of risk and return. It replaces a forward-looking assessment of opportunity with a backwards-looking reference point tied to past cost.
This framing introduces a behavioural anchor. Investors are drawn toward the idea of getting back to even, even when the underlying investment case has weakened. As noted above, such anchoring—reinforced by loss aversion—can delay necessary decisions. Research on investor behaviour shows that this increases the likelihood of holding underperforming assets, a pattern known as the disposition effect (Shefrin & Statman, 1985).
Most reporting frameworks do not challenge this framing because they inherit it from accounting conventions. Independent reporting addresses this by reframing analysis around current value and forward risk. It allows decision-makers to assess capital allocation without embedded bias.
When Risk Signals Become Optional
When it comes to such scenarios, the manager’s defence is usually based on data interpretation.
“This is only a short-term statistical view.”
The Monte Carlo simulation reflects a 60-day horizon based on recent price behaviour and should not override long-term investment convictions.
This assumes that short-term risk signals can be safely ignored when they conflict with the narrative. In practice, probabilistic outputs are included precisely to highlight emerging risk. Dismissing them selectively introduces confirmation bias, where only supportive data informs decisions (Kahneman & Tversky, 1979; Shefrin & Statman, 1985).
There is also a caveat to note: in the below example, the model predicted a low chance of AAPL recovering its book value over the next sixty days. At the end of the period, AAPL actually exceeded its book value handsomely. This is not to devalue the predictive capability of the Monte Carlo simulation: statistics describe the probability of a population, not an individual.
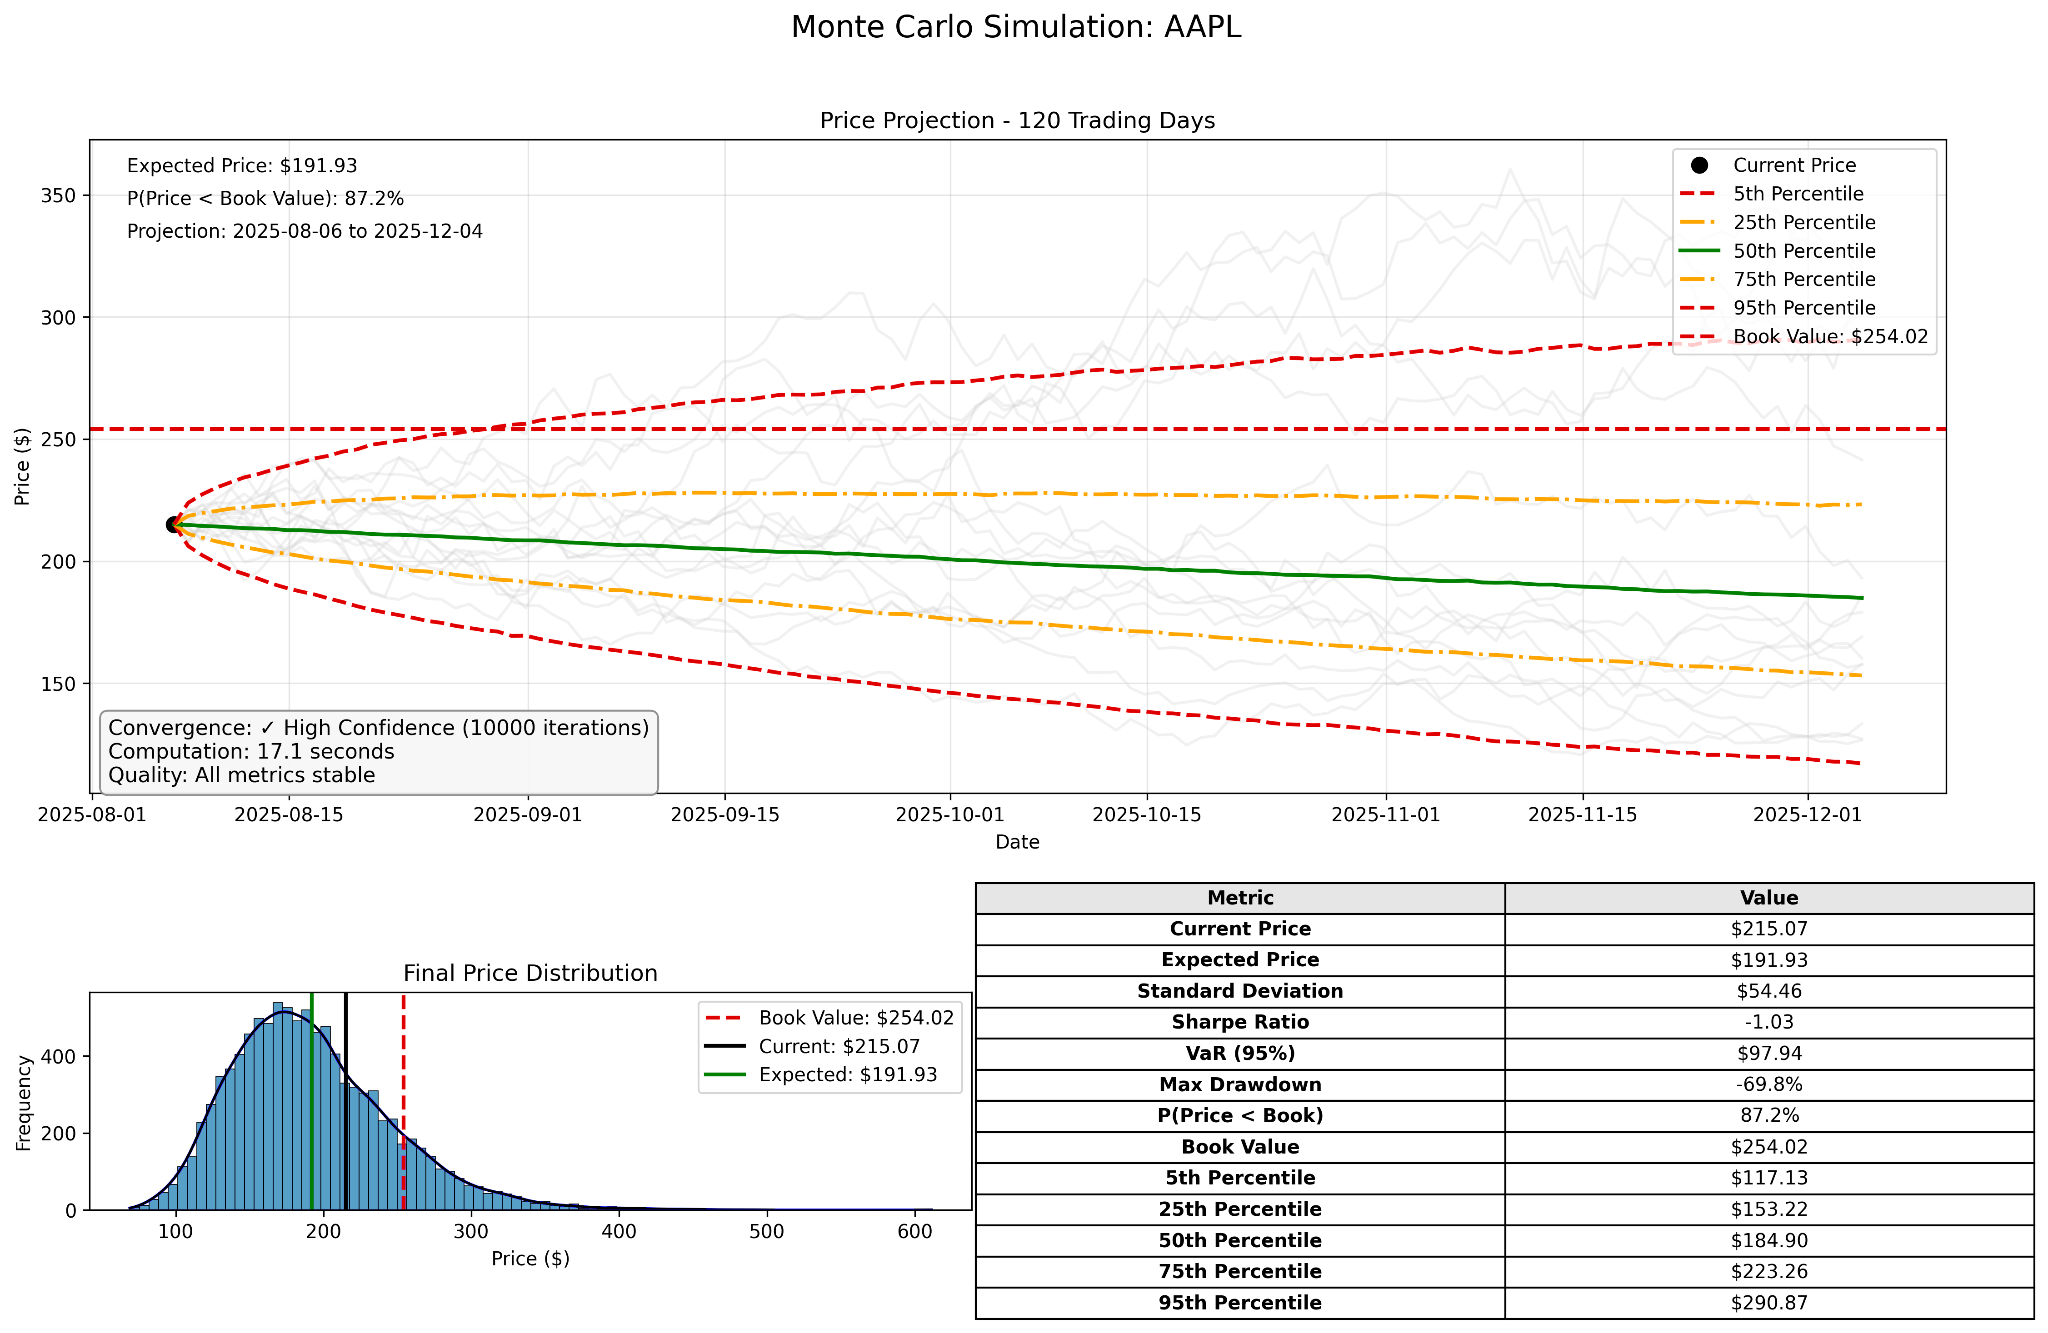
Monte Carlo Simulation Chart
“The model does not capture fundamental quality.”
High-quality companies may show low recovery probabilities due to temporary volatility, not deterioration in underlying value.
This separates market behaviour from investment decisions. Yet price dynamics determine liquidity, drawdown, and opportunity cost. Ignoring a probabilistic downside because it does not align with fundamental conviction weakens risk management. Nevertheless, it remains a useful talking point, as it highlights the tension between conviction-driven investing and market-implied risk.
“Probability is not a decision rule.”
The output is one input among many and should not trigger automatic action.
This is correct in principle. The issue is the absence of accountability. If a model never changes behaviour, its role becomes decorative. Research on financial reporting and governance shows that ineffective use of information weakens oversight and increases agency risk (Armstrong, Guay & Weber, 2010), a core feature of principal–agent dynamics in asset management (Ang, Cole & Lin, 2000).
Each defence reframes the model as informative but non-binding. None defines when its signals should matter. If probability metrics are visible yet do not influence decisions, what mechanism allows them to shape behaviour indirectly?
How Book Value Becomes a Decision Anchor
The distortion begins with how risk is framed.
Monte Carlo simulations generate probability distributions based on historical price behaviour. In this case, the model estimates the likelihood that a stock’s future price will exceed its book value (cost basis) over a defined horizon. The output appears forward-looking, but the reference point is backwards-looking.
This creates the condition for behavioural distortion: risk models anchored to book value embed a recovery mindset into reporting, shifting decisions from forward allocation to loss recapture. The process unfolds in three steps:
1. Framing The Reference Point
By defining risk relative to book value, the model establishes the purchase price as the benchmark. This reframes the decision from “Where should capital go now?” to “Will this position recover what was lost?”
2. Translating Probability into Expectation
A low probability (e.g. <10%) signals that recovery is unlikely in the near term. However, because the metric is tied to past cost, it does not directly evaluate alternative uses of capital. The signal is interpreted emotionally rather than strategically.
3. Reinforcing Holding Behaviour
Instead of triggering reallocation, the metric often delays action. Investors wait for probabilities to improve, effectively anchoring capital to underperforming assets. The model does not cause the behaviour directly, but it legitimises it.
Observed in Practice
During Nokia’s decline between 2007 and 2012, the share price fell from approximately €27 to below €2, within a prolonged period of strategic uncertainty and restructuring (Financial Times, 2015). While this reflects a specific corporate trajectory, it illustrates a broader behavioural pattern: investors often hold declining positions in the expectation of returning to their entry price, a tendency well documented as the disposition effect (Shefrin & Statman, 1985).
Holding such investments over a prolonged period, where the probability of recovering to at least book value is very low (e.g. below 10%), effectively turns the position into a contrarian bet. This may be a valid investment stance, but it requires explicit awareness — both on the part of the investor and the family owning the assets. Without this recognition, the position risks being treated as a recovery case rather than what it has become: a deliberate deviation from consensus expectations that should be labelled and evaluated accordingly.
The Hidden Layer of Opportunity Cost
This mechanism becomes critical when viewed through opportunity cost, defined as the return foregone by not reallocating capital to a better alternative.
A position with a low probability of breakeven is not neutral. It represents capital that is statistically unlikely to recover in the short term, while alternative investments may offer higher expected returns.
Because the model does not compare outcomes across alternatives, it isolates each position. This prevents decision-makers from seeing the portfolio as a set of competing uses of capital.
The result is a reporting structure that appears quantitative but operates as a behavioural anchor. The numbers are correct. The framing determines the outcome.
How to Read Probability Without Bias
To assess whether probability metrics are distorting decisions, the following analytical checks can be applied:
1. Probability vs Forward Return Comparison
What it does: Compares the probability of breakeven with expected forward return scenarios.
Required inputs: Monte Carlo output, expected return assumptions, and relevant alternative investment benchmarks (e.g. hedge fund, private equity, or absolute return indices).
What it reveals: Whether a low probability of recovery corresponds to weak future return potential or simply reflects the distance from cost basis.
Why it matters: It reframes the decision from recovery to allocation.
Subtleties & Limitations:
- Expected returns require assumptions that may introduce model risk
- Does not eliminate uncertainty, only reframes it
2. Cost Basis Sensitivity Check
What it does: Re-runs the analysis using the current market value as the reference point instead of the book value. It is a framing test, not a capital allocation decision.
Required inputs: Current price, volatility inputs, and simulation parameters.
What it reveals: Whether the observed risk signal is driven by the book value anchor or persists when evaluated from current market conditions.
Why it matters: It separates actual market risk from psychological framing, addressing the tendency to anchor decisions to past losses rather than current opportunities.
Subtleties & Limitations:
- May reduce comparability with tax and accounting metrics
- Requires flexibility in reporting systems

Book Value vs. Current Value Scenario Comparison Chart
3. Opportunity Cost Overlay
What it does: Compares each position’s recovery probability with the expected return of alternative assets (e.g. cash, bonds, or equities). It evaluates relative attractiveness, independent of how the probability is measured.
Required inputs: Portfolio allocation, benchmark yields, expected returns.
What it reveals: Whether capital is being held in positions with inferior forward prospects relative to available alternatives.
Why it matters: It introduces explicit competition for capital within the portfolio, highlighting the cost of remaining invested in positions with weak expected outcomes.
Subtleties & Limitations:
- Requires clearly defined alternative benchmarks
- Sensitive to market conditions and assumptions
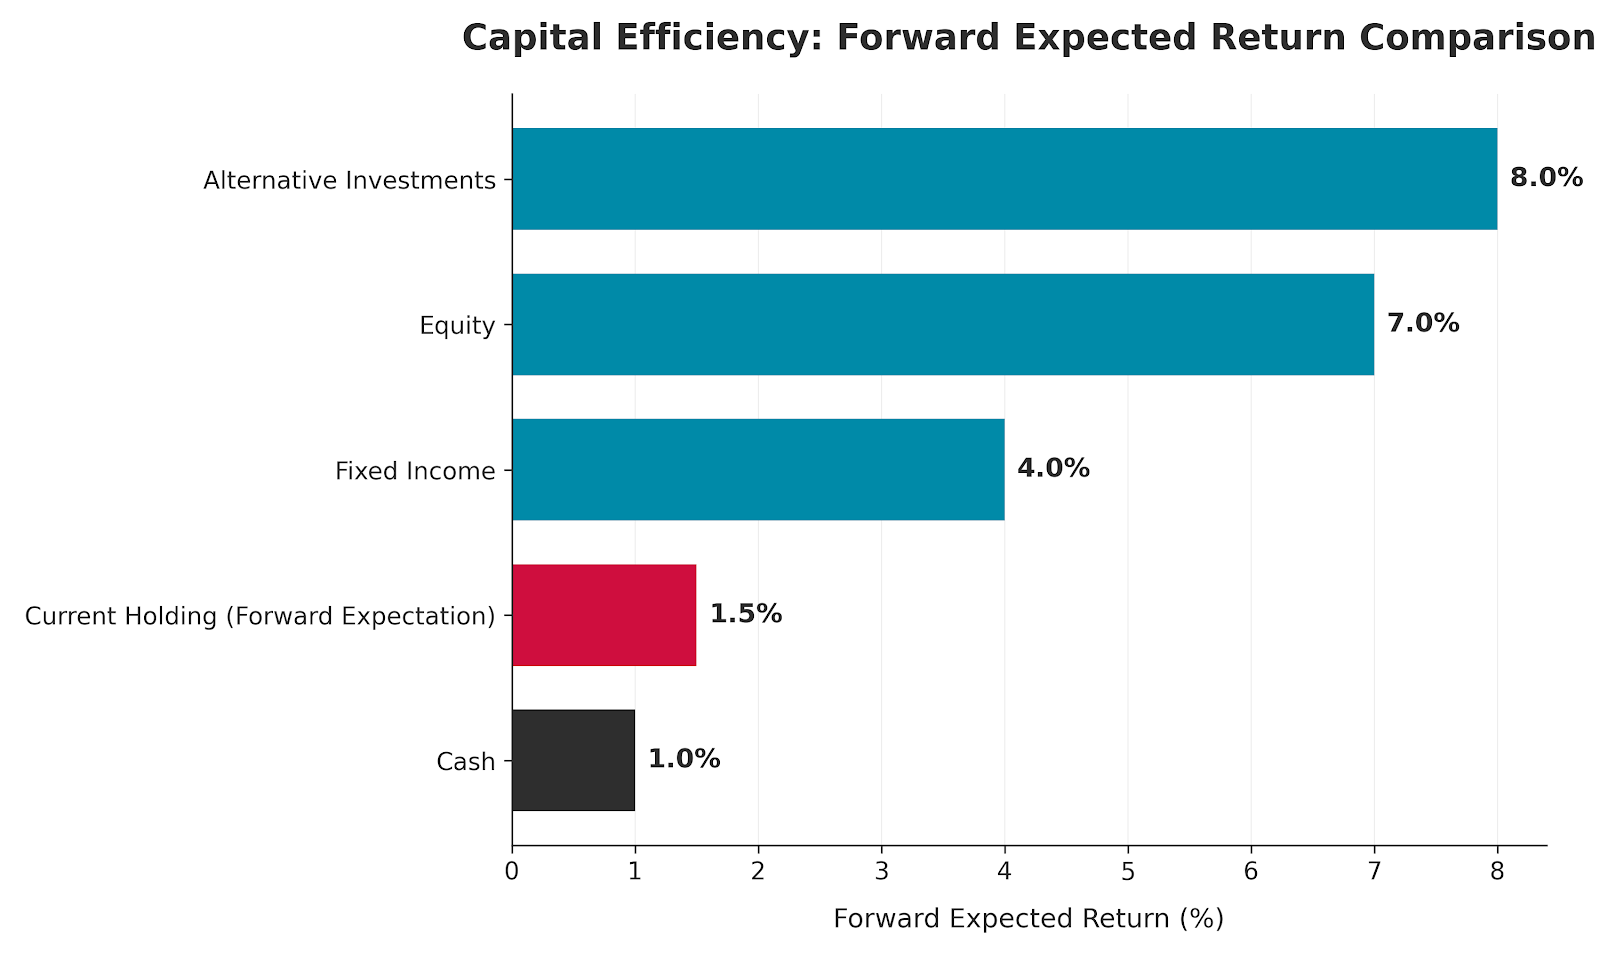
Capital Efficiency: Forward Expected Return Comparison Chart
4. Persistence of Low-Probability Signals
What it does: Tracks positions with low recovery probability across multiple reporting periods. It focuses on behaviour over time, rather than the level of the probability itself.
Required inputs: Historical probability outputs.
What it reveals: Whether low-probability positions are being actively managed or passively held.
Why it matters: It turns repeated signals into a pattern and basis for action, highlighting situations where consistent warnings are not followed by decisions and indicating a potential breakdown in governance.
Subtleties & Limitations:
- Requires a consistent methodology across periods
- Does not capture changes in fundamental outlook
From Identification to Decision-Making
Once identified, these distortions carry direct implications for how decisions are made and capital is allocated:
Framing Defines Decisions
When reporting anchors risk to book value, it shifts focus from future returns to past losses. This alters decision-making without explicit instruction, embedding bias into governance.
Models Without Rules Weaken Oversight
If probabilistic outputs do not trigger review or challenge, they become observational. This increases managerial discretion and reduces accountability in risk management.
Capital Allocation Becomes Path-dependent
Decisions are influenced by entry price rather than current opportunity. This leads to inefficient capital use and delayed reallocation.
Steps to Take
- Redefine the Reference Point
Require that risk metrics be presented relative to the current market value alongside book value. This removes the implicit behavioural anchor. - Introduce Probability Threshold Triggers
Set governance rules for action (e.g. mandatory review if the probability of recovery remains below 20% for two periods). - Embed Opportunity Cost in Reporting
Require comparisons between held positions and alternative investments to force forward-looking decisions. - Separate Risk Measurement from Narrative
Ensure that probabilistic outputs are analysed independently before being contextualised by manager commentary. - Document Override Justifications
If model signals are ignored, a formal rationale is required to maintain accountability and auditability.
Independent Reporting
Most reports inherit their reference points from securities accounting that applies a strict temporal coherence (i.e. every 1 January is a new beginning), not decision-making. By anchoring analysis to book value, they reinforce backwards-looking thinking rather than guiding forward allocation. Independent reporting reframes risk around current exposure and future scenarios, allowing decisions to be made without embedded bias.
This analysis is part of the Inside the Data series, which examines how reporting frameworks influence governance and capital allocation. You can subscribe to our newsletter to follow upcoming pieces.
References
Shefrin, H. and Statman, M. (1985) The Disposition to Sell Winners Too Early and Ride Losers Too Long: Theory and Evidence. Journal of Finance, 40(3), pp. 777–790.
Kahneman, D. and Tversky, A. (1979) Prospect Theory: An Analysis of Decision under Risk. Econometrica, 47(2), pp. 263–292.
Armstrong, C., Guay, W. and Weber, J. (2010) The Role of Information and Financial Reporting in Corporate Governance and Debt Contracting. Journal of Accounting and Economics, 50(2–3), pp. 179–234.
Ang, A., Cole, R. and Lin, J. (2000) Agency Costs and Ownership Structure. Journal of Finance, 55(1), pp. 81–106.
Suri, R. (2015) The rise, fall and rise again of Nokia. Financial Times.
Kenton, W. (2023) Monte Carlo Simulation: Definition and Applications. Investopedia.