
Juan Gris – The Breakfast – Musée National d’Art Moderne
In one analysis of our Executive Reports, a fixed income portfolio reported an average credit rating of A and a duration of 3.8 years — a profile typically interpreted as low risk. Yet a deeper breakdown revealed significant concentration in BBB-rated bonds and a visible shift from short-term (1–3 year) into medium-term maturities (3–7 years).
This is a structural contradiction: a portfolio presented as stable is actively moving into more rate-sensitive and lower-quality segments. Headline metrics remain unchanged, even as risk exposure increases.
This gap exists because standard manager reporting compresses multi-dimensional risk into a single average. These figures are easy to communicate and compare, but they strip out the structure of the portfolio — the distribution that determines how it behaves under stress (Armstrong, Guay & Weber, 2010).
Most asset manager reports are constructed to present outcomes, not to interrogate positioning. Independent reporting addresses this by consolidating data across mandates and reconstructing exposures at a granular level, making shifts in allocation and risk concentration visible across the full portfolio.
The average credit rating, in this context, is a lazy metric. It obscures a critical distinction:
- A portfolio composed primarily of A-rated bonds
- A portfolio split between high-grade (AAA) and lower-grade (BBB or below) exposures
Both can produce the same average. The risk profile is not remotely the same.
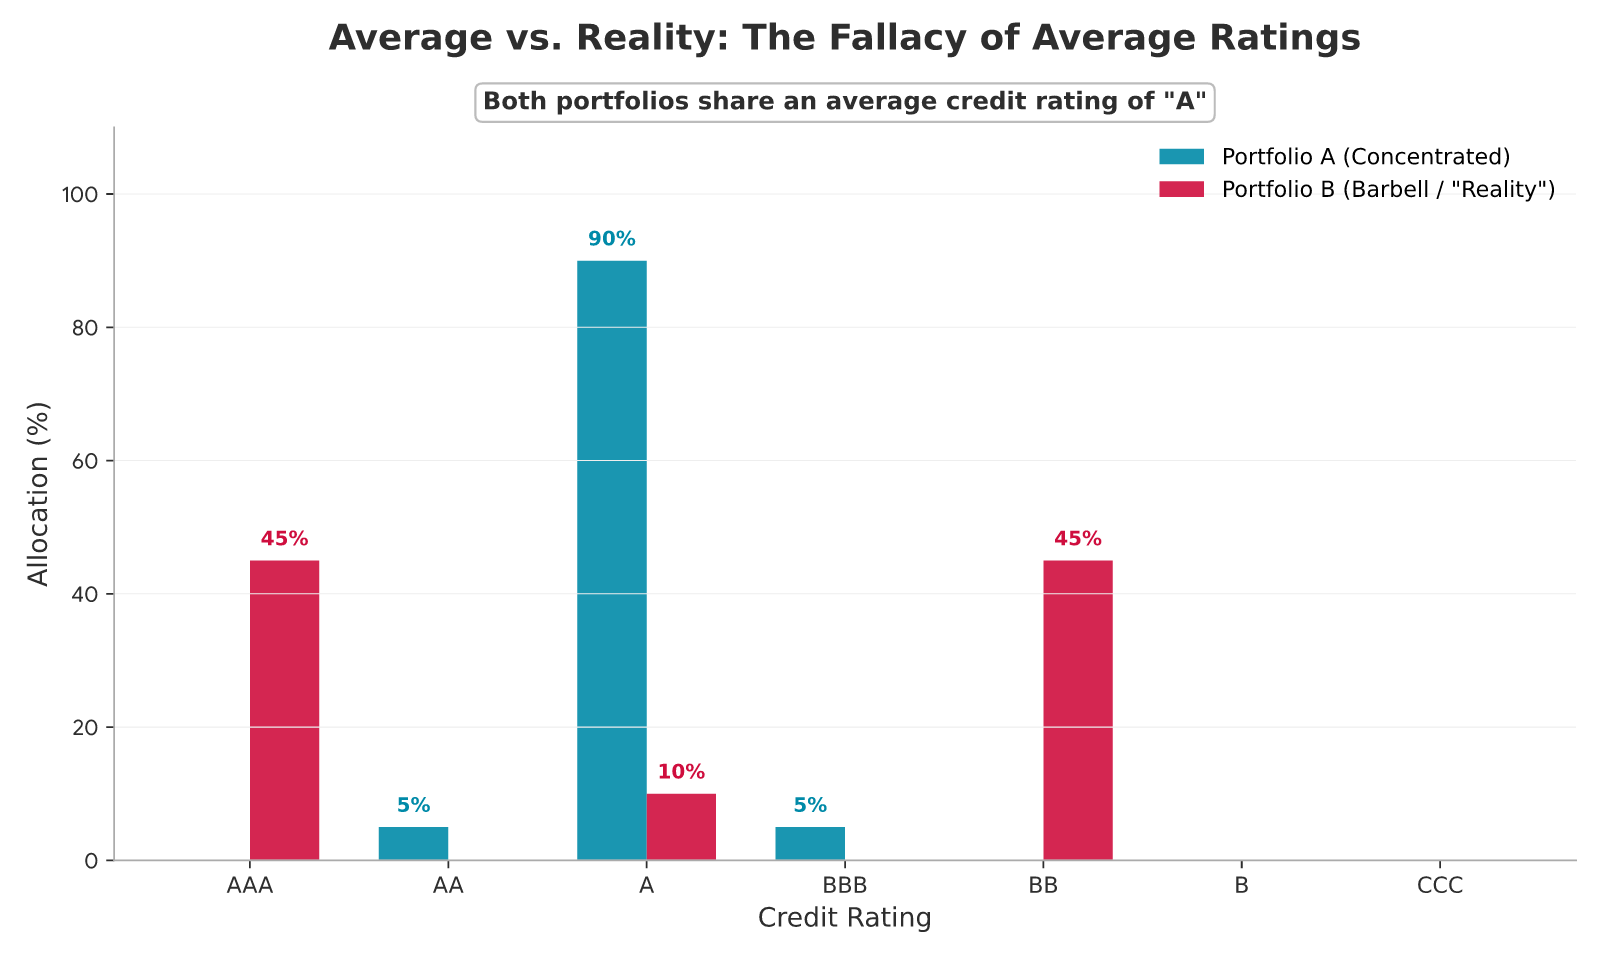
Average vs. Reality Chart
When governance relies on averages, it assumes homogeneity. The result is a reporting framework that confirms expectations while concealing structural change (Ang, Cole & Lin, 2000).
At The Cecily Group, our independent reporting bridges this gap by consolidating data of fragmented “averages” into granular insights to enforce manager accountability. You can explore our methodology at: https://thececilygroup.com/financial-reporting/.
The Manager’s Defence
Managers rarely dispute the numbers, so their defence must rest on interpretation. They would say:
“This is a Barbell Strategy.”
The portfolio is positioned at both ends of the curve — short-term stability and long-term yield — to improve risk-adjusted returns.
This assumes that movements in the yield curve are parallel. In practice, curve shifts are often non-parallel, exposing the portfolio to curve risk, where losses on the long end are not offset by the short end. The diversification benefit is conditional, not structural (CFA Institute; Investopedia).
Whilst there is merit to the Barbell Strategy, the question remains how far the asset manager relies on the parallel shift to occur.
“We Remain Within Investment-grade Limits.”
Allocations are technically compliant, with the portfolio maintaining an overall investment-grade profile.
This defence relies on classification. Bonds at the lower boundary of investment grade (e.g. BBB) exhibit markedly different liquidity and downgrade dynamics. Research shows that opacity in reporting allows risk to accumulate within formal limits, increasing agency costs and weakening oversight (Ang, Cole & Lin, 2000).
Naive Investment Policy Statements look at averages and would thereby allow for a mix-and-match of different qualities. A more prudent approach is
“Duration is Stable, so Rate Risk is Controlled.”
A reported short duration suggests limited sensitivity to interest rate changes.
Duration, as a single measure, assumes a uniform distribution of maturities. A shift from short-term to intermediate or long-term bonds can leave the average largely unchanged while increasing exposure to specific rate scenarios.
Each defence is internally consistent. None addresses where risk is actually being taken. If averages can remain stable while exposures shift, what mechanism allows this repositioning to occur without triggering governance alarms?
The Mechanism of Distortion
The distortion begins with how fixed-income risk is summarised.
Portfolios are typically reported through aggregated metrics: average credit rating, average duration, and yield. These compress two independent dimensions of risk:
- Credit quality (probability of default and downgrade)
- Maturity/duration (sensitivity to interest rate changes)
When combined into single figures, they remove the spatial structure of the portfolio.
This creates the condition for mandate drift: managers can reallocate risk within the portfolio while keeping reported averages broadly unchanged.
The process unfolds in three steps:
-
Reallocation Within Boundaries
Managers shift capital incrementally: from A-rated bonds toward BBB, or from short-dated maturities toward intermediate and long-dated exposures. Each move remains within mandate limits when viewed in isolation.
-
Averaging Masks Concentration
Because averages are weighted, higher-quality or shorter-duration positions offset the visible impact of riskier allocations. A portfolio split between AAA and BBB can still report as “A-”. The redistribution is real, but the signal is diluted (Armstrong, Guay & Weber, 2010).
-
Risk Accumulates Asymmetrically
The portfolio becomes increasingly exposed to specific scenarios — credit downgrades or interest rate shifts — without any corresponding change in headline metrics. The risk is concentrated in particular segments.
A Structural Failure in Practice
In the case of the Third Avenue Focused Credit Fund (Financial Times, 2015), a portfolio presented through conventional metrics masked deep exposure to illiquid, lower-quality bonds. When redemptions accelerated, the fund was unable to liquidate positions and ultimately suspended withdrawals — revealing a structural failure in both liquidity management and reporting transparency.
The Hidden Layer of Liquidity Mismatch
This mechanism becomes critical at the lower boundary of investment grade. Bonds rated BBB sit one downgrade away from high yield. In a stressed market:
- Downgrades force selling due to mandate restrictions
- Liquidity deteriorates sharply
- Bid–ask spreads widen or disappear entirely
If a portfolio is concentrated in this “cliff edge” segment, the transition from investment grade to high yield is a discontinuity.
Because average ratings do not show this concentration, the portfolio appears stable until the moment liquidity is required. By then, the structure — not the average — determines the outcome.
How to See What the Dashboard Hides
Identifying this distortion requires upgrading from summary metrics to structural analysis. The following analytical checks can be applied:
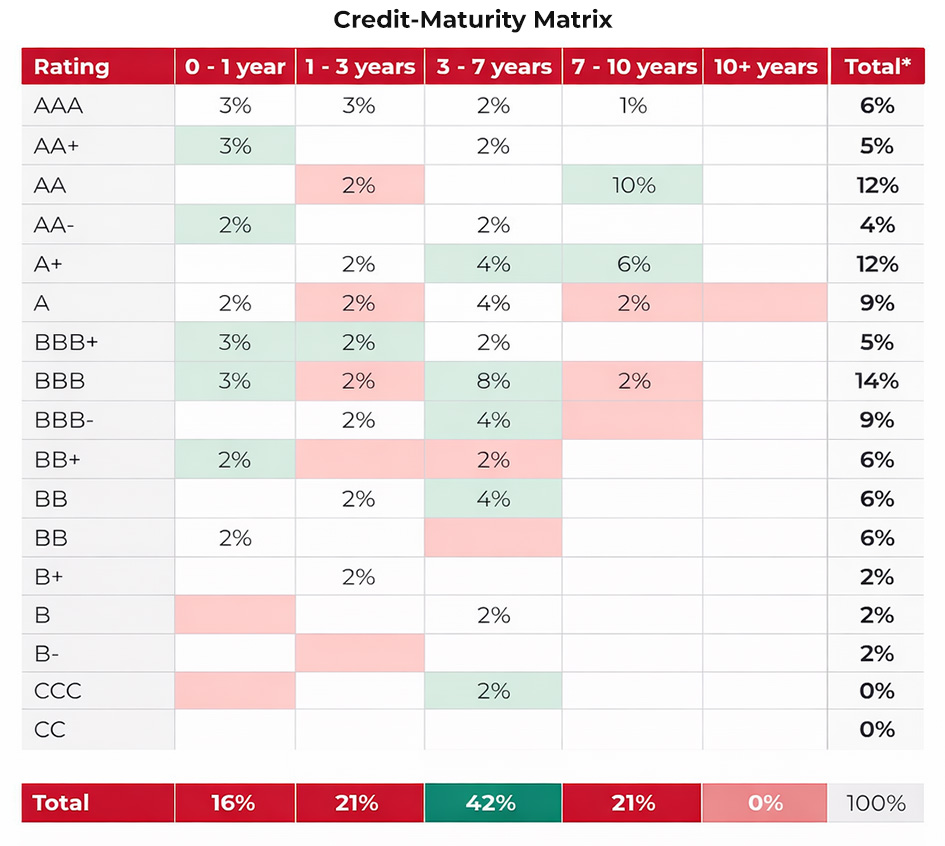
Credit–Maturity Matrix
What it does: Maps the portfolio across two axes — credit quality and maturity — revealing the full distribution of exposures.
Required inputs: Position-level data (rating, maturity or effective duration, market value).
What it reveals: Concentrations in specific “risk pockets” (e.g. BBB, 5–10 year), shifts between maturity buckets, and hidden barbell positioning.
Why it matters: It restores the shape of the portfolio, making visible where returns are being generated and where risk is accumulating.
Subtleties & Limitations:
- Requires consistent treatment of callable bonds (first call vs final maturity)
- Ratings must be standardised across providers
- Rate changes of individual fixed income investments need to be tracked in addition
- Static snapshots can miss intra-period repositioning
Credit-Maturity Matrix Chart
Distribution vs Average Comparison
What it does: Compares headline metrics (average rating, duration) with the underlying distribution.
Required inputs: Weighted averages plus bucketed exposure data.
What it reveals: Divergence between reported profile and actual positioning; highlights whether averages are being “engineered” through offsetting positions.
Why it matters: It directly tests whether governance is relying on misleading summaries.
Subtleties & Limitations:
- Does not capture interaction effects between credit and duration
- Can still understate tail risk if buckets are too broad
The above is, at its basic level, taking the Credit-Maturity Matrix and comparing that to the average figures. This measure may be more interesting to those instances where there is a “simple” Investment Policy Statement in place that just uses averages.
Downgrade Exposure Analysis (“Cliff Edge Test”)
What it does: Measures the proportion of the portfolio one step above high yield (e.g. BBB tier).
Required inputs: Rating distribution at notch level (e.g. BBB+, BBB, BBB-).
What it reveals: Sensitivity to forced selling in a downgrade cycle and potential liquidity stress.
Why it matters: Downgrades are not marginal events—they trigger structural selling pressure and valuation gaps.
Subtleties & Limitations:
- Assumes rating agencies act in a timely manner
- Does not capture issuer-specific liquidity differences
Maturity Shift Tracking
What it does: Tracks changes in allocation across maturity buckets over time.
Required inputs: Historical portfolio snapshots with consistent bucket definitions.
What it reveals: Strategic positioning shifts (e.g. movement from 1–3 year to 3–7 year bonds) that may not affect average duration materially.
Why it matters: It exposes directional bets on interest rates that are otherwise hidden within stable averages.
Subtleties & Limitations:
- Requires consistent time series data
- Interpretation depends on market context (rate cycle phase)
From Diagnosis to Action
These observations translate into a set of recurring risks that governance frameworks should actively guard against:
Visibility Defines Control
When reporting compresses distributions into averages, oversight becomes reactive. Boards are left responding to outcomes rather than monitoring positioning. This weakens the ability to challenge managers before risk materialises.
Mandates Without Structure are Insufficient
Constraints defined by averages allow wide latitude in implementation. This creates a gap between the stated objective (e.g. capital preservation) and the realised exposure, increasing agency risk (Ang, Cole & Lin, 2000).
Risk is Taken in the Margins
Managers do not need to breach limits to alter portfolio behaviour. Incremental reallocations within permissible ranges accumulate into materially different risk profiles, often without triggering formal review.
Steps to Take
- Replace Averages with Distributions
Require reporting that shows full exposure across credit and maturity buckets, not just summary metrics. This establishes a baseline for meaningful oversight. - Define Mandate Constraints by Segment
Set explicit limits for combinations of credit quality and maturity (e.g. maximum allocation to BBB >7 years), rather than relying on portfolio-wide averages. - Monitor the “Cliff Edge”
Track exposure to lower investment-grade tiers and require a documented downgrade response plan from managers. - Introduce Time-Series Analysis
Review how allocations shift over time to identify emerging positioning trends, not just end-state snapshots. - Separate Reporting from Management
Ensure that portfolio analysis is produced independently to reduce bias and reveal discrepancies between narrative and positioning.
Independent Reporting
Quality reporting reduces the gap between what managers know and what asset owners can observe. High-quality, independent reporting protects against misallocation, mispricing, and unmanaged risk (Armstrong, Guay & Weber, 2010). At a governance level, unbiased oversight is a minimum fiduciary standard.
See how independent reporting can strengthen your oversight:
https://thececilygroup.com/financial-reporting/
Stay tuned as I continue unpacking our reporting methodology, and subscribe to our newsletter to follow the full Inside the Data series.
References
Financial Times (2015), Third Avenue fund closure sends shivers through credit markets, Financial Times, December.
Ang, A., Cole, R. and Lin, J. (2000), Agency Costs and Ownership Structure, Journal of Finance.
Armstrong, C., Guay, W. and Weber, J. (2010), The Role of Information and Financial Reporting in Corporate Governance and Debt Contracting, Journal of Accounting and Economics.